ABSTRACT
We investigated the predictors of survival in patients with advanced BTC according to their baseline nutritional status estimated by the Nutritional Risk Screening (NRS)-2002. From September 2006 to July 2017, we reviewed the data of 601 inpatients with BTC. Data on demographic and clinical parameters was collected from electronic medical records, and overall survival (OS) and progression-free survival were analyzed using the Kaplan-Meier method and the stepwise Cox regression analysis. Patients with an NRS-2002 score of ≤ 2, 3, and ≥ 4 were respectively classified as “no risk,” “moderate risk,” “high risk.” Following initial NRS-2002 score, 333 patients (55%) were classified as “no-risk,” 109 patients (18%) as “moderate-risk,” and 159 patients (27%) as “high-risk.” Survival analysis demonstrated significant differences in the median OS: “no-risk”: 12.6 months (95% confidence interval [CI], 11.5–13.7); “moderate-risk”: 6.1 months (95% CI, 4.3–8.0); and “high-risk”: 3.9 months (95% CI, 3.2–4.6) (p < 0.001). NRS-2002 score was an independent factor for OS (hazard ratio [HR], 1.616 for “moderate-risk”, 95% CI, 1.288–2.027, p < 0.001; HR, 2.121 for “high-risk”, 95% CI, 1.722–2.612, p < 0.001), along with liver metastasis, peritoneal seeding, white blood cell count, platelet count, neutrophil-to-lymphocyte ratio, cholesterol, carcinoembryonic antigen, and carbohydrate antigen 19-9. In conclusion, baseline NRS-2002 is an appropriate method for discriminating those who are already malnourished and who have poor prognosis in advanced BTC patient. Significance of these results merit further validation to be integrated in the routine practice to improve quality of care in BTC patients.
-
Keywords: Biliary tract cancer; Survival; Nutrition risk screening 2002 (NRS-2002); Prognosis
INTRODUCTION
Biliary tract cancer (BTC) represents an aggressive malignancy that arises from the biliary tree-lining epithelia. BTC can manifest at various anatomical locations of intra-and extrahepatic bile duct, gall bladder and ampulla of Vater [
1]. BTC is the sixth most common cause of cancer-related mortality in Korea, when 7,179 new cases and 4,871 deaths were reported in 2018 [
2]. The only potentially curative treatment option is surgical resection. However, only about 30% of patients are resectable at the time of diagnosis. The high recurrence rate following surgery even after adjuvant therapy (about 50%) and the frequent presentation of advanced stage at initial diagnosis (approximately 70%) make palliative chemotherapy the mainstay of treatment. For many years, combination chemotherapy of cisplatin and gemcitabine (GemCis) have been the gold standard of treatment for advanced cancer [
3]. However, the median overall survival (OS) was 11.7 months with the overall response rate of just 26% [
3].
Prognostic predictors in advanced BTC have received relatively little attention to date [
4,
5]. Performance status, markers of immunocompetence (such as neutrophil-to-lymphocyte ratio [NLR], white blood cell [WBC] counts, or C-reactive protein levels [CRP]), the primary tumor location, and cancer load (such as metastatic site and number) are some of the suggested ones. However, malnutrition is a serious concern for BTC patients: Most patients are elderly at diagnosis, and they frequently accompany stricture or obstruction at the gastric outlet, duodenum, or pancreatic duct, which lead to early satiety, anorexia, and emesis that necessitate duodenal stent or bypass surgery [
6]. Immune dysfunction brought on by malnutrition may manifest as aberrant neutrophil, macrophage, and lymphocyte numbers. All of these components can have an impact on cancer progression, treatment toxicity, and unfavorable impact on survival.
The Nutritional Risk Screening (NRS)-2002 is a tool made to determine the severity of a disease as well as any present probable undernutrition [
7]. It is recommended by the European Society for Clinical Nutrition and Metabolism (ESPEN) for use in hospitals and for screening purposes within 48 hours of admission, with a final score of 3 indicating nutritional risk [
8]. It has been proven effective in numerous controlled nutrition support trials, which looked at whether this tool could help separate patients who had positive clinical outcomes from those who did not. In addition, baseline nutritional status and nutritional therapies play a significant role in overall patient outcomes and even in outcomes for patients with advanced stage cancer [
9,
10,
11]. However, to our knowledge, no similar research has been done involving patients with advanced BTC.
Since 2006, our institution has made the NRS-2002 the standard screening tool for all cancer patients upon admission. In this study, we examined the relationships between baseline NRS-2002 scores and prognosis in patients with advanced BTC. Finally, we make the recommendation that the initial NRS-2002 evaluation be used as a tool to enable patient categorization by nutritional risk and to optimize treatment.
MATERIALS AND METHODS
Patient eligibility
At the pancreato-biliary cancer center at Gangnam Severance Hospital, Seoul, Korea, from September 2006 to July 2017, 892 patients received a diagnosis of metastatic or recurrent BTC. Age over 18 years, a histologically confirmed BTC, the presence of systemic disease at the time of presentation or after curative resection, and the availability of electronic medical data were the inclusion criteria for this investigation (including treatment information).
The exclusion criteria were as follows: (1) widespread central nervous system or leptomeningeal metastasis, (2) localized disease for which definitive therapy is indicated, (3) synchronous metastatic malignancies other than BTC or (4) uncontrolled infection, active gastrointestinal bleeding, and severe concurrent medical conditions (e.g., advanced liver cirrhosis or chronic kidney disease), as well as (5) lack of follow-up (FU) or transfer to a different hospital before a decision had been made regarding treatment (including diagnosis only).
Of the 892 patients screened, 601 met the above criteria and were included in the study. The study protocol was approved by the Institutional Review Board (IRB) of the Gangnam Severance Hospital (IRB number: 3-2019-0159). The requirement for patient consent was waived considering the retrospective study design.
Clinical data collection
The following clinical details were collected; age, sex, anthropometric data (weight, height, body mass index [BMI]), disease status (recurrent/metastatic), primary tumor location (gallbladder, intrahepatic or extrahepatic bile duct, ampulla), metastasis sites, Eastern Cooperative Oncology Group-performance status (ECOG-PS), and the presence of diabetes mellitus (DM) or jaundice. The following blood and serum biochemistry data were collected at baseline: WBC, hemoglobin (Hb), platelet, CRP, serum protein, albumin, blood urea nitrogen (BUN), aspartate aminotransferase (AST), alanine aminotransferase (ALT), total bilirubin, alkaline phosphatase (ALP), and cholesterol. The tumor markers carcinoembryonic antigen (CEA) and carbohydrate antigen (CA) 19-9 were also collected. The NLR was calculated by dividing the absolute neutrophil count by the absolute lymphocyte count.
Nutritional risk assessment
In the case of metastatic cancer patients, NRS-2002 scoring and nutrition evaluation were performed at the time of first hospitalization after cancer diagnosis and just before chemotherapy. In the case of recurrent cancer patients, it was performed at the time of first hospitalization after recurrence was confirmed, right before chemotherapy.
The nutritional status data collection, NRS and nutritional counselling were performed by 2 investigators (JSP, SEO), who interviewed patients within 48 hours of hospitalization to prepare weight changes and meal records, and a dietary intake survey and food intake frequency were investigated according to the 24-hour recall method. All the implemented data was stored as separate records. Screening for the risk of malnutrition was conducted using the NRS-2002, in which patients are scored in each of the 2 components (1) undernutrition and (2) disease severity, according to whether they are absent, mild, moderate or severe, giving a total score 0–6, with an adjustment for age of ≥ 70 years [
7]. The final scoring of NRS-2002 ranges from 0 to 7.
Moreover, we introduced 2 familiar nutritional indices, prognostic nutritional index (PNI) and nutrition risk index (NRI), for the purpose of correlating these with the NRS-2002 score. PNI [
12] was defined as 10 × serum albumin value (g/dL) + 0.005 × peripheral lymphocyte count (/mm
3). A higher PNI indicates low risk of malnutrition. NRI [
13] was calculated as (1.519 × serum albumin, g/dL) + [41.7 × weight (kg)/ideal body weight (IBW; kg)]. IBW was calculated using the Lorentz formulae; i.e., height (cm) − 100 – {[height (cm) – 150]/4} for men and height (cm) − 100 – {[height (cm) – 150]/2.5} for women.
The hematological and blood chemistry values were transformed to categorical variables according to the upper normal ranges (WBC, Hb, platelet, serum protein, albumin, BUN, AST, ALT, total bilirubin, ALP, cholesterol) or the best cutoff point (CEA, CA19-9, and NLR). The latter were determined using the Contal and O’Quigley method, which calculates the maximum hazard ratio (HR) based on log-rank statistics and estimates the best cutoff value [
14].
The OS was defined as the time from the date of diagnosis to death from any cause. Progression-free survival (PFS) was defined as the time from chemotherapy to disease progression or death from any cause. Survival curves were generated using the Kaplan-Meier method and compared using the log-rank test.
Univariate analysis was performed to determine the association of the following prognostic factors with OS: age, sex, disease status, ECOG-PS, primary site, BMI, WBC and lymphocyte count, Hb, platelet count, serum protein, albumin, BUN, AST, ALT, ALP, cholesterol, CEA, CA19-9, NLR, and PLR. Subsequently, stepwise multivariate analysis based on Cox’s proportional hazard model was performed, using the significant factors identified through univariate analysis. HRs, 95% confidence intervals (CIs), and chi-square scores were obtained for all regressions. All statistical analyses were performed using PASW Statistics ver. 18.0 (SPSS Inc., Chicago, IL, USA), SAS v. 9.4 (SAS Institute Inc., Cary, NC, USA), and R ver. 3.2.4 (Institute for Statistics and Mathematics, Vienna, Austria;
http://www.R-project.org). A p value of < 0.05 was considered significant.
RESULTS
Baseline clinical parameters by NRS-2002 risk groups
The median age of the entire patient group (n = 601) was 67 years, and 346 patients (58%) were men. Patients’ ages ranged from 30 to 91 years. Forty-three percent of cases were of intrahepatic and perihilar bile duct cancer, 30% were of gallbladder cancer, and the remainder were of distal bile duct and periampullary cancer (27%). Regarding disease state, 65% of patients had untreatable metastatic disease at the time of their diagnosis, whereas others had recurring metastatic disease following prior curative resection. More than half of the patients (57%) had metastases at multiple locations. Twenty-two percent of patients had underlying DM, and 22% of patients had jaundice.
At the time of diagnosis, 199 patients (33%) had experienced involuntary weight loss (amounting to more than 5%) over the past 3 months, and 195 patients (32%) had complained of inappetence persistent for more than 1 week. Upon dividing the patients into nutritional risk groups based on the NRS-2002 score, 333 patients (55%) were classified into “no-risk” (score ≤ 2), 109 patients (18%) were into “moderate-risk” (score = 3), and the remaining patients (27%) were included as “high-risk” (score ≥ 4). Demographic characteristics and clinical parameters were significantly different among the 3 risk groups (
Table 1). The “high-risk” group included more elderly patients (median age, 73), peritoneal metastasis, and poor ECOG-PS compared with the “no-risk” and “moderate-risk” groups. Blood tests also showed differences between groups; the “high-risk” group showed higher levels of BUN, total bilirubin, ALT, CRP, and CA19-9. Conversely, albumin and total protein levels were significantly lower in the “high-risk” group, which also presented significantly lower Hb levels and lymphocyte counts.
Table 1Comparison of baseline demographic and clinical parameters by NRS-2002 groups in the patients with advanced biliary tract cancer
Table 1
|
Characteristics |
A: “No-risk” group (n = 374, 56.3%) |
B: “Moderate-risk” group (n = 115, 17.3%) |
C: “High-risk” group (n = 175, 26.4%) |
p value |
p value (post hoc) |
|
Sex |
|
|
|
0.391 |
|
|
Male |
224 (59.9) |
66 (57.4) |
94 (53.7) |
|
Female |
150 (40.1) |
49 (42.6) |
81 (46.3) |
|
Age (median) |
64 (32–88) |
66 (31–91) |
70 (30–91) |
< 0.001 |
A = B < C |
|
ECOG-PS |
|
|
|
< 0.001 |
|
|
0–1 |
281 (75.1) |
52 (45.2) |
51 (29.1) |
|
2–4 |
93 (24.8) |
63 (55.8) |
124 (70.9) |
|
Diabetes mellitus |
|
|
|
0.499 |
|
|
No |
286 (76.5) |
87 (75.7) |
141 (80.6) |
|
Yes |
88 (23.5) |
28 (24.3) |
34 (19.4) |
|
BMI (kg/m2) |
24.0 (17.3–34.3) |
22.4 (17.2–30.1) |
21.1 (12.0–35.6) |
< 0.001 |
A > B > C |
|
Disease status |
|
|
|
< 0.001 |
|
|
Recurrent |
190 (50.8) |
20 (17.4) |
35 (20.0) |
|
Metastatic |
184 (49.2) |
95 (82.6) |
140 (80.0) |
|
Biochemistry |
|
|
|
|
|
|
Albumin (g/dL) |
4.0 (2.4–5.2) |
3.7 (1.7–4.9) |
3.4 (1.9–4.9) |
< 0.001 |
A > B > C |
|
Protein (g/dL) |
7.0 (4.2–9.0) |
6.9 (4.8–8.5) |
6.7 (4.5–8.7) |
< 0.001 |
A = B > C |
|
CRP (mg/L) |
25.5 (0.1–288.5) |
34.6 (0.3–244.5) |
61.9 (0.2–456.2) |
< 0.001 |
A = B < C |
|
Total cholesterol (mg/dL) |
175 (67–580) |
176 (85–762) |
171 (32–748) |
0.738 |
|
|
BUN (mg/dL) |
15.1 (3.0–39.7) |
15.8 (3.6–61.9) |
19.1 (5.6–82.6) |
< 0.001 |
A = B < C |
|
T.bil (mg/dL) |
2.6 (0.1–38.5) |
3.4 (0.2–28.5) |
5.0 (0.2–40.1) |
< 0.001 |
A = B < C |
|
ALP (IU/L) |
206 (45–1,132) |
284 (36–1,125) |
379 (50–2,212) |
< 0.001 |
A < B < C |
|
AST (IU/L) |
56 (11–483) |
78 (14–548) |
89 (13–905) |
< 0.001 |
A < B < C |
|
ALT (IU/L) |
61 (4–485) |
78 (6–669) |
78 (5–933) |
0.077 |
|
|
Tumor marker |
|
|
|
|
|
|
CEA (ng/mL) |
61.7 (0.1–8,281) |
59.6 (0.5–2,355) |
89.1 (0.7–6,404) |
0.782 |
|
|
CA19-9 (IU/mL) |
1,784 (0.6–25,160) |
1,680 (0.7–20,210) |
4.220 (0.8–20,460) |
< 0.001 |
A = B < C |
|
Complete blood count |
|
|
|
|
|
|
Hb (g/dL) |
12.6 (6.5–18.4) |
12.2 (5.1–16.2) |
11.6 (5.0–15.3) |
< 0.001 |
A = B > C |
|
WBC (103/uL) |
7.19 (2.54–23.66) |
8.54 (1.99–21.14) |
9.99 (2.61–44.24) |
< 0.001 |
A < B < C |
|
Neutrophil (103/uL) |
4.75 (0.96–20.71) |
6.12 (1.01–19.05) |
7.66 (1.14–41.20) |
< 0.001 |
A < B < C |
|
Lymphocyte (103/uL) |
1.66 (0.25–3.83) |
1.58 (0.42–4.87) |
1.39 (0.23–5.28) |
< 0.001 |
A = B > C |
|
Platelet (103/uL) |
251 (67–612) |
267 (63–604) |
278 (18–630) |
0.010 |
A = B < C |
|
Primary location |
|
|
|
< 0.001 |
|
|
Gallbladder |
103 (27.5) |
30 (26.1) |
62 (35.4) |
|
Intrahepatic CCC |
87 (23.3) |
42 (36.5) |
50 (28.6) |
|
Extrahepatic CCC |
133 (35.6) |
38 (33.0) |
56 (32.0) |
|
Periampullary |
51 (13.6) |
5 (4.3) |
7 (4.0) |
|
Metastasis site |
|
|
|
|
|
|
Liver |
63 (16.8) |
27 (23.5) |
66 (37.7) |
< 0.001 |
|
Lung |
50 (13.4) |
15 (13.0) |
30 (17.1) |
0.457 |
|
Peritoneum (carcinomatosis) |
50 (13.4) |
15 (13.0) |
30 (17.1) |
0.457 |
Correlation between NRS-2002 risk groups and other nutritional parameters
We correlated the NRS-2002 scores with other nutritional indices. The median actual and lean body weight of the entire patient group was 60.0 kg (ranging from 34.0 to 97.0 kg) and 44.1 kg (ranging from 25.3 to 70.2 kg), respectively. The mean BMI of the whole patient group was 22.9 kg/m2 (ranging from 12.0 to 35.6 kg/m2), which was negatively correlated with the NRS-2002 risk groups. The “no-risk” group had the highest BMI (24.0 kg/m2), while the mean BMI declined to 22.4 and 21.0 kg/m2 in the “moderate-risk” and “high-risk” group, respectively (p < 0.001).
Similarly, the PNI value was negatively correlated with NRS-2002 values. The average PNI values were 48.1 in the “no-risk” group, 45.7 in the “moderate-risk” group, and 40.6 in the “high-risk” group (p < 0.001). This trend was also observed with regard to NRI; the average scores for the “no-risk,” “moderate-risk” and “high-risk” were 106.6, 100.0, and 91.8, respectively (p < 0.001). These findings suggest that baseline nutritional assessment according to the NRS-2002 is well correlated with laboratory parameters in patients with advanced BTC.
When we selected a cutoff of ≥ 3 as indicative of malnutrition, logistic regression analysis revealed the following independent predictors of malnutrition: old age (> 67) (odds ratio [OR], 1.867, 95% CI, 1.266–2.752, p = 0.002), metastatic disease (OR, 2.459, 95% CI, 1.572–3.846, p = 0.001), low albumin (< 3.4 g/dL) (OR, 2.402, 95% CI, 1.456–3.963, p = 0.001), and ECOG-PS (OR, 2.357, 95% CI, 1.815–3.062, p < 0.001).
Prediction of chemotherapy outcome by baseline nutritional assessment
Of all patients, 353 (59%) were treated with a first-line standard GemCis chemotherapy, and 90 patients (19%) received monotherapy with gemcitabine or 5-FU alone. The remaining 158 patients (22%) did not receive any chemotherapy. There was a difference in treatment pattern according to the NRS-2002 risk groups. In the “no-risk” group, 71% of patients received GemCis treatment, while only 35% of the “high-risk” group received the ‘doublet.’
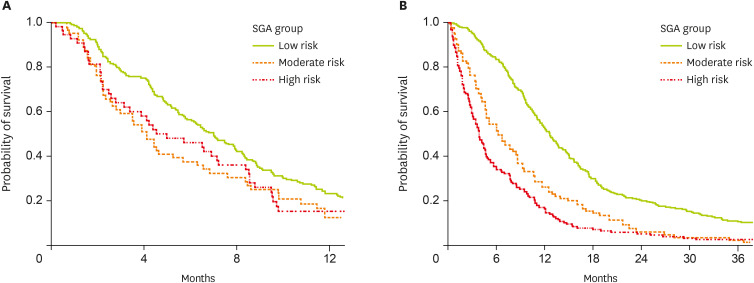
Of the patients who received GemCis chemotherapy, 301 patients progressed after chemotherapy, with a median PFS of 6.3 months (95% CI, 5.4–7.2). Analyzing the PFS according to the NRS-2002 groups, we found that PFS was higher in the “no-risk” group (7.0 months, 95% CI, 5.9–8.1) than in the less favorable groups (“moderate to high-risk” groups, 4.5 months, 95% CI, 3.0–5.7) (p = 0.013) (
Figure 1A). Median OS was also longer according to the risk groups (“no-risk” group [12.8 months, 95% CI, 11.2–14.3] vs. the other 2 groups [8.6 months, 95% CI, 6.2–12.5]) (p < 0.001).
Figure 1
Comparison of survival of patients according to the NRS-2002 risk groups; (A) progression-free survival of the patients who received first-line chemotherapy of GemCis (n = 353), (B) overall survival of the whole patients (n = 601).
NRS, Nutritional Risk Screening; GemCis, gemcitabine plus cisplatin; SGA, subjective global assessment.
Assessment of prognostic factors of the whole patients
The median FU period of the entire study population was 9.4 months (ranging from 0.1 to 120 months), and the median OS was 9.4 months (95% CI, 8.5–10.3 months). When we compared OS between the NRS-2002 groups, we observed significant differences in cumulative OS. The “no-risk” group had a median OS of 12.6 months (95% CI, 11.5–13.7 months) compared with the “moderate-risk” group (6.1 months, 95% CI, 4.3–8.0) and the “high-risk” group (3.9 months, 95% CI, 3.2–4.6) (p < 0.001) (
Figure 1B).
In the univariate analysis, hematological and blood chemistry values were transformed into categorical variables according to the upper normal values. The cutoff value for CEA, CA19-9, and NLR, which were derived from the Contal and O’Quigley method, were 9 ng/mL, 120 U/mL, and 3.0, respectively. Univariate analysis showed that many factors, including NSR-2002 groups, were associated with OS. These included disease status, metastatic sites, tumor location, ECOG-PS, BMI, and numerous tumor markers and hematologic/blood chemistry parameters
Finally, in the multivariate analysis, NRS-2002 groups were identified as the most significant determinants for OS (HR, 1.611 for “moderate-risk,” 95% CI, 1.285–2.022, p < 0.001; HR, 2.129 for “high-risk,” 95% CI, 1.728–2.624, p < 0.001). Other independent factors included the presence of liver metastasis and peritoneal metastasis, low WBC, platelet, and cholesterol values, high NLR, and tumor markers (CEA and CA19-9) (
Table 2).
Table 2Univariate and multivariate analysis of overall survival
Table 2
|
Category |
Characteristics |
Variables |
Univariate analysis |
Multivariate analysis |
|
HR |
95% CI |
p value |
HR |
95% CI |
p value |
|
Demographic |
Age |
≥ 67/< 67 |
1.176 |
0.997–1.386 |
0.054 |
|
|
|
|
Sex |
Female/Male |
0.966 |
0.818–1.141 |
0.684 |
|
|
|
|
Disease status |
Metastatic/Recurrent |
1.686 |
1.414–2.010 |
< 0.001 |
|
|
|
|
ECOG-PS |
2–4/0–1 |
2.249 |
1.902–2.659 |
< 0.001 |
|
|
|
|
Primary site |
Intrahepatic CCC/Periampullary |
1.771 |
1.309–2.395 |
< 0.001 |
|
|
|
|
Extrahepatic CCC/Periampullary |
1.441 |
1.029–2.018 |
0.034 |
|
|
|
|
Gallbladder/Periampullary |
1.620 |
1.182–2.221 |
0.003 |
|
|
|
|
Liver metastasis |
Yes/No |
1.732 |
1.460–2.055 |
< 0.001 |
1.701 |
1.421–2.033 |
< 0.001 |
|
Lung metastasis |
Yes/No |
1.380 |
1.097–1.737 |
0.006 |
|
|
|
|
Peritoneal metastasis |
Yes/No |
1.925 |
1.584–2.339 |
< 0.001 |
1.735 |
1.416–2.126 |
< 0.001 |
|
DM |
Yes/No |
0.940 |
0.771–1.146 |
0.539 |
|
|
|
|
Hematologic |
Hb (g/dL) |
< 12.0/≥ 12.0 |
1.420 |
1.202–1.667 |
< 0.001 |
|
|
|
|
WBC (μL) |
< 10,800/≥ 10,800 |
1.929 |
1.550–2.400 |
< 0.001 |
0.759 |
0.599–0.961 |
0.022 |
|
Platelet (μL) |
≥ 150K/< 150K |
1.358 |
1.036–1.780 |
0.027 |
0.658 |
0.496–0.874 |
0.004 |
|
NLR |
≥ 3/< 3 |
1.998 |
1.691–2.361 |
< 0.001 |
1.373 |
1.138–1.657 |
0.001 |
|
Biochemical |
CRP (mg/L) |
≥ 6.0/< 6.0 |
1.920 |
1.613–2.285 |
< 0.001 |
|
|
|
|
Cholesterol (mg/dL) |
≥ 139/< 139 |
0.701 |
0.582–0.843 |
< 0.001 |
0.763 |
0.630–0.925 |
0.006 |
|
Protein (g/dL) |
< 6.9/≥ 6.9 |
1.317 |
1.116–1.555 |
< 0.001 |
|
|
|
|
Albumin (g/dL) |
< 3.4/≥ 3.4 |
1.635 |
1.342–1.992 |
< 0.001 |
|
|
|
|
BUN (mg/dL) |
≥ 23/< 23 |
1.397 |
1.080–1.807 |
0.011 |
|
|
|
|
ALP (IU/L) |
≥ 123/< 123 |
1.485 |
1.254–1.759 |
< 0.001 |
|
|
|
|
AST (IU/L) |
≥ 30/< 30 |
1.275 |
1.076–1.509 |
0.005 |
|
|
|
|
ALT (IU/L) |
≥ 33/< 33 |
1.106 |
0.938–1.303 |
0.231 |
|
|
|
|
Bilirubin (mg/dL) |
≥ 1.2/< 1.2 |
1.169 |
0.986–1.387 |
0.073 |
|
|
|
|
CEA (ng/mL) |
≥ 9/< 9 |
1.826 |
1.524–2.188 |
< 0.001 |
1.377 |
1.136–1.670 |
0.001 |
|
CA19-9 (U/mL) |
≥ 120/< 120 |
1.529 |
1.294–1.806 |
< 0.001 |
1.248 |
1.045–1.489 |
0.014 |
|
Nutritional |
NRS-2002 risk groups |
Moderate/Low |
1.895 |
1.516–2.368 |
< 0.001 |
1.616 |
1.288–2.027 |
< 0.001 |
|
High/Low |
2.615 |
2.150–3.181 |
< 0.001 |
2.121 |
1.722–2.612 |
< 0.001 |
|
BMI (kg/m2)*
|
< 18.5/18.5–25.0 |
1.513 |
1.092–2.097 |
0.013 |
|
|
|
|
> 25.0/18.5–25.0 |
0.901 |
0.744–1.092 |
0.290 |
|
|
|
|
Treatment |
Chemotherapy |
Monotherapy/No treatment |
0.543 |
0.417–0.709 |
< 0.001 |
|
|
|
|
Gemcitabine doublet/No treatment |
0.438 |
0.361–0.531 |
< 0.001 |
|
|
|
DISCUSSION
To our knowledge, this study is the first to use the NRS-2002 as a fundamental nutritional evaluation tool for patients with advanced BTC. Prognosis of malignant disease is influenced not only by tumor-specific markers (reflecting cancer burden), but also by more constitutional markers that present the patients’ condition. These markers include performance, weight loss, and immune-competence-reflecting parameters. Among these, ECOG-PS is a well-known, robust prognostic factor in wide variety of cancer types. Weight loss indicates malnutrition and tumor-related inflammation induced by cytokines. High neutrophil and/or low lymphocyte counts can contribute to a tumor-promoting microenvironment characterized by suppressed immune-competence [
15]. Therefore, as patients’ nutritional status reflects the constitution of all these parameters, nutritional assessment at the time of diagnosis may stratify patients according to the prognosis.
There is no consensus on the best way of screening the nutritional status of cancer patients, although several nutritional screening tools are available. A large comparative study has shown that the NRS-2002 has better sensitivity or specificity than malnutrition universal screening tool and NRI, compared to subjective global assessment (SGA) [
16]. In this regard, we found that NRS-2002 was fully suitable for advanced BTC patients, since many recognized prognostic factors (such as the type of the primary tumor, performance status, and symptoms) are well correlated with NRS-2002 score. The first highlight of our study is that 45% of the patients were at risk of malnutrition (NRS-2002 score ≥ 3). Although we had not compared the NRS-2002 score with PG-SGA, we introduced this cutoff point according to the study of Orell-Kotikangas et al. [
17], which showed that a cutoff of ≥ 3 was highly sensitive and specific in indicating malnutrition in head and neck cancer patients. The prevalence of malnutrition in BTC patients has not been previously determined. The PreMio study, which evaluated the prevalence of malnutrition in patients at their first medical oncology visit, reported that 65% of patients with stage M1 liver and bile duct cancer met the criteria of cachexia (characterized by weight loss > 5% or by the dual criteria of BMI < 20 with weight loss of 2%–5%) [
18]. However, there are no reports on the incidence of malnutrition in Asian populations, especially in patients with advanced disease. Our data are intermediate between the values extrapolated for hospitalized cancer patients in large surveys of populations with mixed pathologies, which range from 27% to 43% [
19].
The second highlight of our study is NRS-2002 score was another factor for prognosis, along with already-known parameters of tumor marker and some hemato-serological factors. Moreover, in the patients who received standard GemCis chemotherapy, NRS-2002 score could effectively discriminate PFS. It is crucial that patients at risk are identified as early as possible to prevent malnutrition and its consequences—treatment failure and poor survival. Accordingly, nutritional intervention should be started as early as possible before any significant weight loss, which could compromise the overall efficacy of nutritional intervention occurred. The ESPEN guidelines on nutrition in cancer patients outline the need for the early detection and treatment of malnutrition [
20,
21]. In subgroup analysis, OS is 13.4 vs 12.0 months between patients with an NRS-2002 score of 1 and 2, respectively. Although this difference was not statistically significant (p = 0.301), we suggest that preventive nutrition intervention be applied even to the patients with an NRS-2002 score of 2. This will be even more important for patients who will evidently face nutritional deterioration during chemotherapy or radiotherapy. The time between initial diagnosis and the start of first-line chemotherapy is typically a few weeks, and it is possible to sufficiently improve nutritional intake during these weeks.
Our data also demonstrated that the NRS-2002 score was practicable to stratify patients for standard chemotherapy. However, the retrospective study design has some limitations with regard to interpreting the effects of the GemCis regimens used here. GemCis is accepted widely in Korea since 2011, before which various monotherapies and doublet regimens containing 5-FU, gemcitabine, and platinum agents were used. In the “no-risk” group, 70% of the patients received GemCis and 13% of patients refused or were excluded from chemotherapy due to old age, poor nutrition, and combined inflammation. By contrast, only 35% of patients in the “high-risk” group received GemCis and 53% did not have any systemic treatment. Our PFS data demonstrated that “no-risk” patients had a prolonged PFS of 12.7 months, which were superior to the results of ABC-02 trial (PFS of 8.0 months). However, even the “moderate-risk” and “high-risk” groups had PFS of around 8.6 months [
3]. Therefore, it would be imprudent to conclude that chemotherapy is contraindicated for “moderate-to-high risk groups,” where survival curves are still separated between GemCis and supportive care-only group, Therefore, this should be interpreted with caution as the data in question is from retrospective analysis and highly-selective patients had been included for GemCis chemotherapy. Nevertheless, we suggest here that nutritional assessment be integrated into a more sophisticated scoring system for treatment decision-making. The ideal system can be utilized as follows: for “no-risk” patients, we speculate that their survival may be extended more by active chemotherapy (GemCis) or even more aggressive ‘triplet’ therapy or clinical trials of novel agent. Conversely, “high-risk” group patients would not be expected to show significant benefits from active treatment.
A limitation of this study is the fact that body composition measurements were not included during the data collection. The phase angle, which can be determined by bioelectrical impedance analysis, has been found to be a prognostic indicator in several diseases, including cancer. The phase angle can also be a sensitive indicator of malnutrition [
22]. In addition, sarcopenia, characterized by a decline of skeletal muscle, low muscle strength, and/or physical performance, has also emerged to be an important prognostic factor. This is associated with poor performance status, toxicity from chemotherapy, and shorter time of tumor control. There is limited data about sarcopenia and associated factors in cancer patients. Future studies on the baseline nutritional status of patients with advanced BTC should include more meticulous measurement of body composition and sarcopenia. A large-scale multicenter study is necessary to confirm our findings.
Although including many patients, this is a single center study, and there is a limitation in that it is a cross-sectional research in which the test set and the validation set are not separated. As researchers have a convenient clinical application in mind at the beginning of the study, continuous variables such as blood tests were dichotomized according to normal and abnormal ranges, and cutoff points were set for other variables as much as possible from a statistical point of view. However, these results may vary depending on the selection of statistical tools and data extraction method. Therefore, for a more general application, external validation performed with an independent data set from another hospital is required. It is preferable to interpret this study as follows rather than generalizability of the results: as the nutritional status at the time of diagnosis has prognostic significance to the patient, objective and credible nutritional evaluation should be implemented as a routine practice from the time cancer patients visit the hospital.
In conclusion, we showed that the NRS-2002’s assessment of nutritional status at baseline correlates with the prognosis of patients with advanced BTC. As a result, we recommend that NRS-2002 be used as a suitable and trustworthy indication of malnutrition to help with patient prediction. Following that, baseline nutritional status can be further integrated into the implementation of a prognostic score system, which can give BTC patients with more complex risk stratification in daily clinical practice. This system may aid physicians in making treatment decisions.
Health Fellowship Foundation
Ministry of Health and Welfarehttps://doi.org/10.13039/501100003625
1420060
NOTES
-
Funding: This study was supported by a grant from the Health Fellowship Foundation (to Oh SE) and the grant from the National R&D Program for Cancer Control, Ministry of Health & Welfare, Republic of Korea (to Jeung HC, No. 1420060).
-
Conflict of Interest: The authors declare that they have no competing interests.
-
Author Contributions:
Conceptualization: Jeung HC.
Data curation: Jeung HC, Park JS, Oh SE.
Funding acquisition: Oh SE, Jeung HC.
Investigation: Park JS, Oh SE.
Methodology: Park JS, Oh SE.
Project administration: Park JS, Oh SE.
Supervision: Jeung HC.
Validation: Jeung HC.
Visualization: Park JS, Oh SE.
Writing - original draft: Oh SE.
Writing - review & editing: Park JS, Jeung HC.
ACKNOWLEDGEMENTS
We would like to thank all the patients with advanced biliary cancer whose data were included in this study.
REFERENCES
- 1. Patel T. Cholangiocarcinoma--controversies and challenges. Nat Rev Gastroenterol Hepatol 2011;8:189-200.
- 2. Hong S, Won YJ, Lee JJ, Jung KW, Kong HJ, Im JS, Seo HG. Community of Population-Based Regional Cancer Registries. Cancer statistics in Korea: incidence, mortality, survival, and prevalence in 2018. Cancer Res Treat 2021;53:301-315.
- 3. Valle J, Wasan H, Palmer DH, Cunningham D, Anthoney A, Maraveyas A, Madhusudan S, Iveson T, Hughes S, Pereira SP, Roughton M, Bridgewater J. ABC-02 Trial Investigators. Cisplatin plus gemcitabine versus gemcitabine for biliary tract cancer. N Engl J Med 2010;362:1273-1281.
- 4. Park HS, Park JS, Chun YJ, Roh YH, Moon J, Chon HJ, Choi HJ, Park JS, Lee DK, Lee SJ, Yoon DS, Jeung HC. Prognostic factors and scoring model for survival in metastatic biliary tract cancer. Cancer Res Treat 2017;49:1127-1139.
- 5. McNamara MG, Templeton AJ, Maganti M, Walter T, Horgan AM, McKeever L, Min T, Amir E, Knox JJ. Neutrophil/lymphocyte ratio as a prognostic factor in biliary tract cancer. Eur J Cancer 2014;50:1581-1589.
- 6. Acquisto S, Iyer R, Rosati LM, Pinheirn N, Driskill K, Musto K, Lowitzer H, Bradley E, Drapek L. Cholangiocarcinoma: treatment, outcomes, and nutrition overview for oncology nurses. Clin J Oncol Nurs 2018;22:E97-102.
- 7. Kondrup J, Rasmussen HH, Hamberg O, Stanga Z. Ad Hoc ESPEN Working Group. Nutritional risk screening (NRS 2002): a new method based on an analysis of controlled clinical trials. Clin Nutr 2003;22:321-336.
- 8. Kondrup J, Allison SP, Elia M, Vellas B, Plauth M. Educational and Clinical Practice Committee, European Society of Parenteral and Enteral Nutrition (ESPEN). ESPEN guidelines for nutrition screening 2002. Clin Nutr 2003;22:415-421.
- 9. Park JS, Kim HM, Jeung HC, Kang SA. Association between early nutritional risk and overall survival in patients with advanced pancreatic cancer: a single-center retrospective study. Clin Nutr ESPEN 2019;30:94-99.
- 10. Trestini I, Carbognin L, Sperduti I, Bonaiuto C, Auriemma A, Melisi D, Salvatore L, Bria E, Tortora G. Prognostic impact of early nutritional support in patients affected by locally advanced and metastatic pancreatic ductal adenocarcinoma undergoing chemotherapy. Eur J Clin Nutr 2018;72:772-779.
- 11. Caccialanza R, Pedrazzoli P, Cereda E, Gavazzi C, Pinto C, Paccagnella A, Beretta GD, Nardi M, Laviano A, Zagonel V. Nutritional support in cancer patients: a position paper from the Italian Society of Medical Oncology (AIOM) and the Italian Society of Artificial Nutrition and Metabolism (SINPE). J Cancer 2016;7:131-135.
- 12. Mohri Y, Inoue Y, Tanaka K, Hiro J, Uchida K, Kusunoki M. Prognostic nutritional index predicts postoperative outcome in colorectal cancer. World J Surg 2013;37:2688-2692.
- 13. Adejumo OL, Koelling TM, Hummel SL. Nutritional Risk Index predicts mortality in hospitalized advanced heart failure patients. J Heart Lung Transplant 2015;34:1385-1389.
- 14. Contal C, O’Quigley J. An application of changepoint methods in studying the effect of age on survival in breast cancer. Comput Stat Data Anal 1999;30:253-270.
- 15. Powell DR, Huttenlocher A. Neutrophils in the tumor microenvironment. Trends Immunol 2016;37:41-52.
- 16. Kyle UG, Kossovsky MP, Karsegard VL, Pichard C. Comparison of tools for nutritional assessment and screening at hospital admission: a population study. Clin Nutr 2006;25:409-417.
- 17. Orell-Kotikangas H, Österlund P, Saarilahti K, Ravasco P, Schwab U, Mäkitie AA. NRS-2002 for pre-treatment nutritional risk screening and nutritional status assessment in head and neck cancer patients. Support Care Cancer 2015;23:1495-1502.
- 18. Muscaritoli M, Lucia S, Farcomeni A, Lorusso V, Saracino V, Barone C, Plastino F, Gori S, Magarotto R, Carteni G, Chiurazzi B, Pavese I, Marchetti L, Zagonel V, Bergo E, Tonini G, Imperatori M, Iacono C, Maiorana L, Pinto C, Rubino D, Cavanna L, Di Cicilia R, Gamucci T, Quadrini S, Palazzo S, Minardi S, Merlano M, Colucci G, Marchetti P. PreMiO Study Group. Prevalence of malnutrition in patients at first medical oncology visit: the PreMiO study. Oncotarget 2017;8:79884-79896.
- 19. Bozzetti F, Mariani L, Lo Vullo S, Amerio ML, Biffi R, Caccialanza G, Capuano G, Correja I, Cozzaglio L, Di Leo A, Di Cosmo L, Finocchiaro C, Gavazzi C, Giannoni A, Magnanini P, Mantovani G, Pellegrini M, Rovera L, Sandri G, Tinivella M, Vigevani E. The nutritional risk in oncology: a study of 1,453 cancer outpatients. Support Care Cancer 2012;20:1919-1928.
- 20. Arends J, Bachmann P, Baracos V, Barthelemy N, Bertz H, Bozzetti F, Fearon K, Hütterer E, Isenring E, Kaasa S, Krznaric Z, Laird B, Larsson M, Laviano A, Mühlebach S, Muscaritoli M, Oldervoll L, Ravasco P, Solheim T, Strasser F, de van der Schueren M, Preiser JC. ESPEN guidelines on nutrition in cancer patients. Clin Nutr 2017;36:11-48.
- 21. Arends J, Baracos V, Bertz H, Bozzetti F, Calder PC, Deutz NE, Erickson N, Laviano A, Lisanti MP, Lobo DN, McMillan DC, Muscaritoli M, Ockenga J, Pirlich M, Strasser F, de van der Schueren M, Van Gossum A, Vaupel P, Weimann A. ESPEN expert group recommendations for action against cancer-related malnutrition. Clin Nutr 2017;36:1187-1196.
- 22. Władysiuk MS, Mlak R, Morshed K, Surtel W, Brzozowska A, Małecka-Massalska T. Bioelectrical impedance phase angle as a prognostic indicator of survival in head-and-neck cancer. Curr Oncol 2016;23:e481-e487.