ABSTRACT
People with higher genetic predisposition to obesity are more susceptible to cardiovascular diseases (CVDs) and healthy plant-based foods may be associated with reduced risks of obesity and other metabolic markers. We investigated whether healthy plant-foods-rich dietary patterns might have inverse associations with cardiometabolic risk factors in participants at genetically elevated risk of obesity. For this cross-sectional study, 377 obese and overweight women were chosen from health centers in Tehran, Iran. We calculated a healthy plant-based diet index (h-PDI) in which healthy plant foods received positive scores, and unhealthy plant and animal foods received reversed scores. A genetic risk score (GRS) was developed based on 3 polymorphisms. The interaction between GRS and h-PDI on cardiometabolic traits was analyzed using a generalized linear model (GLM). We found significant interactions between GRS and h-PDI on body mass index (BMI) (p = 0.02), body fat mass (p = 0.04), and waist circumference (p = 0.056). There were significant gene-diet interactions for healthful plant-derived diets and BMI-GRS on high-sensitivity C-reactive protein (p = 0.03), aspartate aminotransferase (p = 0.04), alanine transaminase (p = 0.05), insulin (p = 0.04), and plasminogen activator inhibitor 1 (p = 0.002). Adherence to h-PDI was more strongly related to decreased levels of the aforementioned markers among participants in the second or top tertile of GRS than those with low GRS. These results highlight that following a plant-based dietary pattern considering genetics appears to be a protective factor against the risks of cardiometabolic abnormalities.
-
Keywords: Genetic risk score; Obesity; Healthy-plant based dietary index; Cardiometabolic risk factors
INTRODUCTION
Approximately one-third of all global deaths are related to cardiovascular disease (CVD), which remains a major cause of morbidity, premature mortality, and health loss for all of the world [
1,
2]. The risk factors for cardiometabolic disease are high waist circumference (WC), low high-density lipoprotein (HDL) cholesterol, high triglycerides (TGs), high low-density lipoprotein (LDL) cholesterol, hypertension, and insulin resistance. Atherosclerotic CVD and diabetes mellitus can be attributed to these risk factors [
3]. In 2017, CVDs were responsible for approximately 17.8 million deaths [
2]. By 2030, it is predicted to rise to 23.6 million deaths from CVDs [
4]. Also, the premature death rate due to CVDs is increasing in Iran, along with all regions of the world [
5]. Overweight and obesity, inflammation, hypertension, hyperlipidemia, and insulin resistance are part of the risk factors for CVDs [
6,
7,
8,
9].
Several studies have demonstrated the importance of adhering to healthy dietary patterns in preventing CVD-related risk factors for their nutrients that can improve CVD risk profiles [
10,
11,
12]. Several recent prospective studies in the USA have detected an association between higher intake of healthy plant-based foods and lower consumption of less healthy plant-based foods and animal foods [
7,
11] with a lower incidence of CVDs, coronary heart disease (CHD) and type 2 diabetes. They have developed new indices such as the healthy plant-based diet index (h-PDI) and the unhealthy plant-based diet index (uPDI), which capture the synergistic and graded intake of 3 categorical foods [
13,
14]. Vegan and vegetarian diets are some examples of plant-based diets that consist of more consumption of whole grains, vegetables, fruits, legumes, and nuts and less intake of uPDI or animal products. Preventing chronic diseases by following the h-PDI and less following the uPDI may contribute to improved bone health, inflammation, type 2 diabetes, and insulin resistance [
15,
16]. Also, it has been suggested that a plant-based diet index (PDI) can be used to predict future CVD, CHD, and type 2 diabetes events, but in a clinical setting and different populations, it is not yet clear [
10].
On the other hand, genetic predisposition has also been implicated as a significant risk factor for CVDs. In this regard, a genetic risk score (GRS) could easily determine genetic factors affecting CVDs by combining accumulated genetic risk alleles for each single nucleotide polymorphism (SNP) that has a combined effect of multiple SNPs and is considered to be an effective tool for detecting cardiometabolic risk factors and predicting them [
17,
18,
19]. A large variety of studies have implicated caveolin-1 (CAV-1) SNP, abundant in adipocytes [
20], in the development of obesity, dyslipidemia, high blood pressure, and atherosclerosis [
21,
22,
23,
24,
25]. In addition, previous studies have reported the association between the risk allele C for melanocortin 4 receptor (MC4R) rs17782313 and cardiovascular risk factors such as higher body mass index (BMI), insulin resistance, and high blood pressure [
26,
27,
28,
29,
30]. Furthermore, it has been reported that cryptochromes (Cry) 1 play an important role in metabolism regulation, obesity, and insulin resistance [
31,
32,
33]. Therefore, the above genetic variants have previously been reported to be individually associated with overweight, obesity, and higher BMI in some populations [
34,
35].
It has been reported that higher intake of healthy dietary patterns and PDI can contribute to reducing genetic risk factors of obesity, CVD, CHD, and type 2 diabetes [
36,
37,
38]. However, we still know little about the potential interactions between PDI and CVD susceptibility. Additionally, there has also been no direct evidence yet as to whether genetic factors contribute to the association. Therefore, the present study has been undertaken to assess the interaction between BMI-GRS based on 3 SNPs such as MC4R (rs17782313), CAV-1 (rs3807992) and Cry-1 (rs2287161) with PDI on CVD risk factors to improve the detection of overweight and obese women at a higher risk of developing cardiometabolic risk factors and to prevent or improve CVD risk factors with dietary intervention. The present study have been addressed the issue of obesity and cardiovascular disease by considering GRS based on 3 SNPs such as MC4R (rs17782313), CAV-1 (rs3807992) and Cry-1 (rs2287161) and environmental factors such as h-PDI with a comprehensive approach.
MATERIALS AND METHODS
Study population
Three hundred and seventy-seven overweight or obese women took part in this cross-sectional study. Tehran University of Medical Sciences (TUMS) in Tehran, Iran, reviewed and approved the written informed consent of all study participants. Their ages ranged from 18 to 58 years and their BMI ranged from ‘25–40 kg/m2,’ which refers to health centers in Tehran, Iran. The exclusion criteria were diabetes types I and II, CVD, malignancies, liver and kidney disease, thyroid disease, menopause, pregnancy, lactation, smoking, any acute and chronic diseases, getting supplementation for weight loss, dieting during the last year, and receiving lipid, glucose, and blood pressure lowering drugs. This study was conducted according to the guidelines laid down in the Declaration of Helsinki and all procedures involving human subjects were approved by the Ethics Committee of the TUMS and assigned the number IR.TUMS.MEDICINE.REC.1400.1515 for ethical considerations. Written informed consent was obtained from all subjects.
Body composition analysis
Utilizing the InBody 770 scanner from InBody Co. (Seoul, Korea) and following the manufacturer’s protocol, we measured body composition using a bioelectrical impedance analyzer (BIA) [
39]. In accordance with the manufacturer’s instructions, participants are required to remove extra clothing and metal objects, which include earrings, rings, and watches, along with shoes, coats, and sweaters. The examination takes nearly 15 seconds, and the BIA calculates weight, BMI, WC, waist to hip ratio (WHR), body fat mass (BFM), body fat (BF%), bone mineral content (BMC), and visceral fat area (VFA).
BIA measured weight, BMI, and other anthropometric characteristics. We measured hip circumference and WC using the most prominent portion and the narrowest portion, respectively, with a precision of 0.5 cm. The height of each participant was measured and recorded with 0.5 cm precision by using a non-stretch tape measure in a standing up and unshod position.
Assessment of physical activity
We measured physical activity based on the short-form of the International Physical Activity Questionnaire (IPAQ). A validity and reliability assessment of IPAQ questionnaires was conducted across 12 countries to calculate all participants’ physical activity over the past 7 days. These questionnaires had high criterion reliability, with a Spearman’s ρ correlation score of 0.8 and a median validation score of 0.30, which was similar to other validation studies. Physical activity in the last week was measured using IPAQ, a validated self-report instrument [
40].
We collected venous blood between 8:00 a.m. and 10:00 a.m. after fasting overnight. We centrifuged all of the serum, aliquoted it, stored it at −80°C, and analyzed it all with a single assay technique. We measured fasting blood glucose (FBS), TG and total cholesterol (TC) by using glucose oxidase-phenol 4-aminoantipyrine peroxidase and glycerol-3-phosphate oxidase–phenol 4-aminoantipyrine peroxidase enzymatic endpoints, respectively. LDL and HDL cholesterols were measured by using a direct enzymatic clearance assay. We assessed serum inflammatory markers via an immunoturbidimetric assay (high sensitivity assay, Hitachi 902; Randox Laboratories, Crumlin, UK). Galectin, monocyte chemoattractant protein-1 (MCP-1), and high-sensitivity C-reactive protein (hs-CRP) were measured via standard protocols.
In triplicate, plasminogen activator inhibitor-1 (PAI-1) was evaluated using a Human PAI-1*96 T ELISA kit from Crystal Chem (Elk Grove Village, IL, USA). The intra coefficient of variation (CV) and inter CV were both 2.19% and 4.4%, respectively, and the minimum detectable insulin concentration was 1.76 mIU/mL.
Fasting Plasma Glucose × Fasting Serum Insulin22.5 was used to calculate Homeostasis Model Assessment (HOMA) for Insulin Resistance [
41]. We used the Hitachi 902 kit (Randox Laboratories) for all measurements and assessed all samples by standard methods at the Nutrition and Biochemistry Laboratory of the School of Nutritional and Dietetics at TUMS.
A dietary exposure was evaluated through the use of a validated 147-item semi-quantitative food frequency questionnaire (FFQ) that has been previously validated according to reliability and validity [
42]. In the presence of a dietitian, participants recorded their consumption frequency in grams and milliliters based on their usual diet. Utilizing the NUTRITIONIST 4 (First Data Bank, San Bruno, CA, USA) food analyzer, dietary intake was analyzed for energy intake, macronutrients, and micronutrients [
43].
The plant-based dietary pattern was calculated using Satija et al. [
13,
14]. Three indices are included: the PDI, the h-PDI, and the uPDI. Food items were classified into 18 groups based on their similarities in nutrients, including 3 categories of animal food, healthy plant food, and unhealthy plant food. Healthy or unhealthy plant foods were categorized based on existing evidence on the associations of the foods with cardiometabolic abnormalities. Healthy plant foods included whole grains, fruits, vegetables, nuts, legumes, vegetable oil, vegetarian protein alternatives, and tea/coffee. Consumption of fruit juices, sugar-sweetened beverages, refined grains, sweets and desserts, and potatoes was included in the unhealthy plant foods group. Consumption of potatoes was considered in the unhealthy plant food group to be consistent with the methods in previous studies [
13,
14]. Obtaining animal food items includes animal fat, dairy products, eggs, fish, seafood, meats, and other animal-based foods. These food items were then converted to quintiles of consumption, and a score of 1 to 5 was applied to each item. According to PDI, participants in the highest and lowest quintiles of plant food consumption received a score of 5 and 1, respectively. Furthermore, those participants consuming the largest amounts of animal foods were assigned a score of 1, while those consuming the least amounts of animal foods were assigned a score of 5. The h-PDI was calculated based on participants’ consumption of healthy plant foods. Participants with the highest consumption and those with the lowest consumption received a score of 5 and 1, respectively. We summed the scores to obtain a total score ranging from 18 to 90 for h-PDI. Higher total scores for h-PDI indicated higher adherence to that dietary pattern, ranging from 18 to 90 for h-PDI.
We extracted the total DNA using the salting out method [
44]. Subsequently, a 1% agarose gel was used to assess the DNA integrity, whereas a nanodrop 8000 Spectrophotometer (Thermo Scientific, Waltham, MA, USA) was used to assess DNA concentration. SNP genotyping was carried out using the TaqMan Open Array (Life Technologies Corporation, Carlsbad, CA, USA) [
45].
The forward primer for CAV-1 (rs3807992) is 3′-AGTATTGACCTGATTTGCCATG-5′ and the reverse primer is 5′-GTCTTCTGGAAAAAGCACATGA-3′. The fragments containing three genotypes were distinguished: GG, GA, and AA. The Cry1 (rs2287161) forward primer is 5′-GGAACAGTGATTGGCTCTATCT-3′ and the reverse primer is 5′-GGTCCTCGGTCTCAAGAAG-3′. Then, the fragments containing three genotypes were distinguished: CC, GC, and GG. The MC4R gene primer was selected based on a previous study [
46]. The MC4R (rs17782313) forward primer is 5′-AAGTTCTACCTACCATGTTCTTGG-3′ and the reverse primer is 5′-TTCCCCCTGAAGCTTTTCTTGTCATTTTGAT-3′. Then, fragments containing three genotypes were distinguished: CC, CT, and TT. We created the GRS by combining three single nucleotide polymorphisms (CAV-1 [rs3807992], Cry-1 [rs2287161], and MC4R [rs17782313]) that had previously been linked to obesity-related traits in GWAS and other studies [
24,
34,
47,
48,
49]. The risk alleles for higher BMI were assigned to each SNP by recoding them into 0, 1, or 2. Using the risk alleles of the three SNPs, the unweighted GRS was calculated. Higher scores indicate a greater genetic susceptibility to higher BMI on the GRS scale, which ranges from 0 to 6 [
50].
The Kolmogorov-Smirnov test was used to check the normal distribution of data. Pearson’s χ2 test was used for the Hardy-Weinberg equilibrium. Descriptive analysis was used to assay general characteristics of participants by the mean ± standard deviation (SD), minimum, and maximum. Analysis of variance and analysis of covariance were performed to compare the body composition, blood pressure and metabolic and inflammatory profiles between subjects. A generalized linear model (GLM) was used in crude and adjusted models to evaluate the interactions between GRS and h-PDI concerning metabolic risk factors of the cardiovascular system. Adjustments were made for age, physical activity, energy intake, and BMI. All statistical analysis was performed using SPSS version 23.0 (IBM Corp., Armonk, NY, USA). All reported p values were 2-sided, and a p value lower than 0.05 was considered statistically significant and for interaction p value lower than 0.1 was set as statistically significant.
RESULTS
Participant characteristics
The current study was carried out on 377 women classified as overweight or obese. The means and SD of age, weight, BMI, and WC of individuals were 36.72 ± 9.17 years, 80.62 ± 11.33 kg, 31.02 ± 3.85 kg/m2, and 99.18 ± 9.59 cm, respectively.
Difference in means of cardiometabolic variables across h-PDI
The main characteristics of the study population in relation to the tertile categories of the healthy plant-based diet index are presented in
Table 1. Before adjustment for age, BMI, total energy intake, and physical activity, marginal significant differences for the HOMA index (p = 0.06) were found in participants with higher scores of h-PDI. After adjustment for confounding factors, there was a borderline significant difference for WHR (p = 0.07), although no significant differences were found for BMI. In addition, individuals in the last tertile of h-PDI were more likely to be older in both crude (p
< 0.001) and adjusted (p = 0.002) models. Lower h-PDI was also related to high hs-CRP in crude (p = 0.005) and after adjusting (p = 0.03) among the study participants.
Table 1Anthropometric body composition, blood parameters and blood pressure according to tertile categories of h-PDI
Table 1
|
Variables*
|
h-PDI |
|
T1 (< 51) |
T2 (51–57) |
T3 (> 57) |
p value |
p value†
|
|
Age (yr) |
34.25 ± 9.06 |
36.58 ± 9.35 |
39.50 ± 8.37 |
< 0.001
|
0.002
|
|
Body weight (kg) |
82.06 ± 11.54 |
79.70 ± 11.19 |
80.10 ± 11.21 |
0.20 |
0.23 |
|
BMI (kg/m2) |
31.22 ± 4.13 |
30.90 ± 3.82 |
30.93 ± 3.59 |
0.76 |
0.46‡
|
|
Body composition |
|
|
|
|
|
|
WC (cm) |
100.34 ± 9.90 |
98.94 ± 9.50 |
98.22 ± 9.30 |
0.20 |
0.24‡
|
|
WHR (ratio) |
0.94 ± 0.05 |
0.93 ± 0.05 |
0.92 ± 0.05 |
0.11 |
0.07
|
|
BFM (kg) |
35.37 ± 8.50 |
33.83 ± 7.87 |
33.59 ± 7.57 |
0.16 |
0.17 |
|
BF (%) |
42.59 ± 5.73 |
41.86 ± 5.21 |
41.68 ± 5.09 |
0.36 |
0.20 |
|
BMC (g) |
2.66 ± 0.32 |
2.63 ± 0.34 |
2.65 ± 0.37 |
0.73 |
0.39 |
|
VFA (cm2) |
169.94 ± 40.10 |
164.58 ± 36.19 |
162.27 ± 36.28 |
0.25 |
0.22 |
|
Blood pressure |
|
|
|
|
|
|
SBP (mmHg) |
110.83 ± 12.86 |
110.07 ± 12.99 |
112.96 ± 14.69 |
0.32 |
0.43 |
|
DBP (mmHg) |
77.27 ± 9.18 |
77.47 ± 9.70 |
77.86 ± 9.91 |
0.91 |
0.62 |
|
Blood sample |
|
|
|
|
|
|
FBS (mg/dL) |
88.09 ± 7.94 |
86.73 ± 9.98 |
87.18 ± 10.57 |
0.69 |
0.71 |
|
Total cholesterol (g/dL) |
188.44 ± 35.70 |
178.95 ± 35.80 |
184.35 ± 35.44 |
0.26 |
0.19 |
|
TG (mg/dL) |
121.47 ± 65.82 |
113.27 ± 57.18 |
127.89 ± 83.06 |
0.39 |
0.53 |
|
HDL (mg/dL) |
46.68 ± 9.58 |
46.44 ± 9.54 |
46.84 ± 12.35 |
0.96 |
0.97 |
|
LDL (mg/dL) |
94.93 ± 25.10 |
91.12 ± 23.11 |
96.47 ± 23.35 |
0.32 |
0.59 |
|
hs-CRP (mg/L) |
5.80 ± 4.71 |
5.32 ± 4.67 |
3.96 ± 4.10 |
0.005
|
0.03
|
|
HOMA index |
3.60 ± 1.24 |
3.34 ± 1.17 |
3.11 ± 1.36 |
0.06
|
0.13 |
|
Insulin (mIU/mL) |
1.24 ± 0.25 |
1.18 ± 0.20 |
1.21 ± 0.22 |
0.29 |
0.74 |
|
AST (IU/L) |
19.09 ± 9.07 |
17.04 ± 5.16 |
17.61 ± 7.80 |
0.23 |
0.65 |
|
ALT (IU/L) |
21.41 ± 15.40 |
17.43 ± 9.53 |
19.01 ± 14.01 |
0.18 |
0.55 |
|
MCP-1 (ng/mL) |
45.97 ± 62.33 |
59.22 ± 103.66 |
49.47 ± 103.99 |
0.68 |
0.18 |
|
Galectin 3 (ng/mL) |
6.87 ± 9.50 |
3.28 ± 5.85 |
3.65 ± 7.60 |
0.24 |
0.51 |
|
PAI-1 (ng/mL) |
16.41 ± 24.10 |
17.73 ± 28.63 |
14.62 ± 34.72 |
0.84 |
0.66 |
Cardiometabolic variable mean differences across GRS
Individuals in the highest tertile of GRS were characterized as having higher BMI (p = 0.01), BFM (p = 0.03), and VFA (p = 0.05) in the adjusted model. Also, among GRS tertiles, a significant difference was observed in the percent of BF (p = 0.02). Apart from a marginal significant difference for hs-CRP (p = 0.07), there were no significant differences for the remaining cardiometabolic parameters (
Table 2).
Table 2Anthropometric body composition, blood parameters and blood pressure according to tertile categories of GRS
Table 2
|
Variables*
|
GRS |
|
T1 (< 3) (n = 123) |
T2 (= 3) (n = 89) |
T3 (> 3) (n = 124) |
p value |
p value†
|
|
Age (yr) |
36.68 ± 9.57 |
37.20 ± 9.00 |
36.42 ± 8.95 |
0.81 |
0.69 |
|
Body weight (kg) |
79.80 ± 10.34 |
80.60 ± 11.71 |
81.44 ± 12.01 |
0.48 |
0.58‡
|
|
BMI (kg/m2) |
30.27 ± 3.62 |
31.21 ± 3.85 |
31.63 ± 3.98 |
0.01
|
0.01‡
|
|
Body composition |
|
|
|
|
|
|
WC (cm) |
98.02 ± 9.00 |
99.46 ± 9.61 |
100.15 ± 10.08 |
0.17 |
0.16 |
|
WHR (ratio) |
0.93 ± 0.05 |
0.93 ± 0.04 |
0.93 ± 0.05 |
0.59 |
0.41 |
|
BFM (kg) |
32.92 ± 7.21 |
34.85 ± 8.08 |
35.21 ± 8.58 |
0.04
|
0.03
|
|
BF (%) |
41.14 ± 5.10 |
42.68 ± 5.03 |
42.51 ± 5.72 |
0.04
|
0.02
|
|
BMC (g) |
2.68 ± 0.33 |
2.63 ± 0.36 |
2.62 ± 0.33 |
0.26 |
0.20 |
|
VFA (cm2) |
160.25 ± 36.11 |
167.07 ± 38.74 |
170.06 ± 37.90 |
0.08
|
0.05
|
|
Blood pressure |
|
|
|
|
|
|
SBP (mmHg) |
110.76 ± 11.95 |
111.12 ± 15.20 |
112.02 ± 14.31 |
0.80 |
0.82 |
|
DBP (mmHg) |
77.38 ± 9.66 |
77.64 ± 10.09 |
77.68 ± 9.24 |
0.97 |
0.70 |
|
Blood sample |
|
|
FBS (mg/dL) |
87.05 ± 9.04 |
86.03 ± 7.44 |
88.38 ± 11.60 |
0.36 |
0.69 |
|
Total cholesterol (g/dL) |
187.07 ± 34.38 |
184.49 ± 39.12 |
178.48 ± 34.55 |
0.27 |
0.17 |
|
TG (mg/dL) |
122.10 ± 67.92 |
109.47 ± 51.66 |
127.20 ± 81.90 |
0.33 |
0.34 |
|
HDL (mg/dL) |
47.04 ± 9.85 |
48.43 ± 12.41 |
44.93 ± 9.98 |
0.14 |
0.22 |
|
LDL (mg/dL) |
95.93 ± 22.20 |
96.98 ± 25.40 |
89.87 ± 24.08 |
0.13 |
0.09 |
|
hs-CRP (mg/L) |
4.59 ± 3.97 |
4.62 ± 4.14 |
5.81 ± 5.28 |
0.04
|
0.07
|
|
HOMA index |
3.36 ± 1.16 |
3.11 ± 1.14 |
3.44 ± 1.48 |
0.32 |
0.43 |
|
AST (IU/L) |
17.63 ± 6.50 |
18.19 ± 9.31 |
17.72 ± 6.85 |
0.89 |
0.80 |
|
ALT (IU/L) |
18.56 ± 13.36 |
19.59 ± 14.88 |
19.32 ± 11.23 |
0.87 |
0.75 |
|
Insulin (mIU/mL) |
1.19 ± 0.22 |
1.22 ± 0.22 |
1.22 ± 0.23 |
0.70 |
0.55 |
|
MCP-1 (ng/mL) |
48.38 ± 90.65 |
50.73 ± 86.85 |
58.19 ± 104.53 |
0.79 |
0.70 |
|
Galectin 3 (ng/mL) |
3.44 ± 6.91 |
5.53 ± 7.90 |
4.12 ± 7.61 |
0.64 |
0.61 |
|
PAI-1 (ng/mL) |
17.10 ± 35.99 |
11.55 ± 18.08 |
18.71 ± 29.69 |
0.47 |
0.43 |
Participants’ dietary intake based on the h-PDI
Greater h-PDI was associated with higher amounts of whole grains, fruits, nuts, and vegetable oils, as well as lower amounts of total energy intake, sugar, and saturated fatty acid (SFA) (
Table 3).
Table 3Nutrient intake according to tertile categories of h-PDI
Table 3
|
Variables*
|
h-PDI |
|
T1 (< 51) |
T2 (51–57) |
T3 (> 57) |
|
h-PDI |
46.53 ± 3.96 |
54.52 ± 1.49 |
61.96 ± 3.67 |
|
Food group |
|
|
Whole grains (g/d) |
96.25 ± 88.33 |
102.21 ± 96.54 |
133.99 ± 112.00 |
|
Fruits (g/d) |
439.63 ± 305.16 |
479.97 ± 315.94 |
518.59 ± 351.96 |
|
Vegetables (g/d) |
394.70 ± 276.14 |
365.96 ± 206.07 |
495.08 ± 279.51 |
|
Nuts (g/d) |
14.15 ± 15.41 |
15.92 ± 22.65 |
16.05 ± 18.36 |
|
Legumes (g/d) |
38.25 ± 25.57 |
44.46 ± 40.18 |
62.00 ± 48.59 |
|
Vegetable oils |
12.51 ± 10.19 |
16.49 ± 14.72 |
18.69 ± 17.85 |
|
Tea and coffee (mL/d) |
741.20 ± 675.91 |
614.46 ± 442.54 |
891.49 ± 1021.07 |
|
Fruit juices (mL/d) |
24.96 ± 50.48 |
38.79 ± 175.30 |
8.06 ± 16.88 |
|
Sugar sweetened beverages (mL/d) |
75.41 ± 99.82 |
39.09 ± 65.48 |
12.34 ± 18.15 |
|
Refined grains (g/d) |
420.39 ± 204.50 |
321.83 ± 172.65 |
264.85 ± 142.56 |
|
Potatoes |
26.86 ± 22.15 |
24.35 ± 26.14 |
19.68 ± 21.37 |
|
Sweets and desserts (g/d) |
51.54 ± 32.18 |
39.29 ± 43.99 |
32.84 ± 36.79 |
|
Animal fat (g/d) |
15.45 ± 16.72 |
14.27 ± 20.52 |
9.04 ± 18.34 |
|
Dairy (mL/d) |
467.79 ± 284.37 |
330.58 ± 206.32 |
344.74 ± 227.46 |
|
Eggs (g/d) |
28.73 ± 21.53 |
23.99 ± 14.73 |
20.48 ± 16.72 |
|
Fish and sea food (g/d) |
14.85 ± 15.03 |
9.43 ± 10.03 |
8.43 ± 9.55 |
|
Meat (g/d) |
84.72 ± 63.77 |
60.04 ± 44.48 |
53.15 ± 39.47 |
|
Miscellaneous animal-based food (g/d) |
26.17 ± 26.87 |
13.92 ± 19.71 |
10.32 ± 13.61 |
|
Nutrient intake |
|
|
Energy (kcal/d) |
2,902.16 ± 805.82 |
2,506.99 ± 818.91 |
2,468.18 ± 726.51 |
|
Protein (g/d) |
103.88 ± 34.02 |
84.40 ± 27.90 |
85.73 ± 29.07 |
|
Carbohydrate (g/d) |
405.08 ± 116.63 |
355.04 ± 134.86 |
355.47 ± 113.40 |
|
Total fat (g/d) |
104.05 ± 35.66 |
91.63 ± 33.76 |
88.10 ± 32.65 |
|
PUFA (g/d) |
20.32 ± 8.33 |
20.02 ± 9.90 |
19.41 ± 9.17 |
|
SFA (mg/d) |
32.96 ± 12.47 |
27.34 ± 11.05 |
24.52 ± 9.39 |
|
Sodium (mg/d) |
4,946.65 ± 1,962.36 |
4,231.40 ± 1,522.02 |
4,213.44 ± 1,467.14 |
|
Potassium (mg/d) |
4,749.53 ± 1,755.38 |
4,162.93 ± 1,561.31 |
4,685.78 ± 1,837.96 |
|
Calcium (mg/d) |
1,463.66 ± 572.72 |
1,145.56 ± 451.13 |
1,215.40 ± 542.17 |
|
Vitamin C (µmol/L) |
185.37 ± 97.15 |
180.40 ± 103.80 |
200.75 ± 143.33 |
|
Total fiber (g/d) |
50.10 ± 24.53 |
44.20 ± 19.75 |
48.50 ± 19.50 |
Interaction between h-PDI and GRS on cardiometabolic risk factors
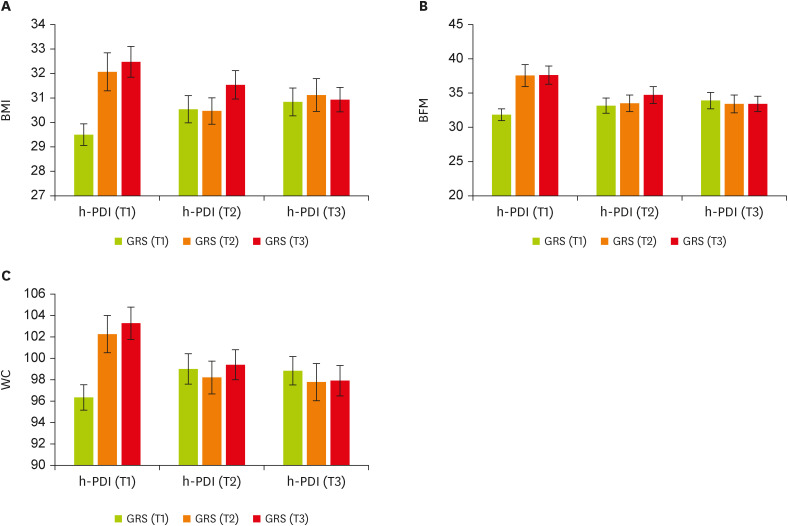
Using the GLM, we found significant interactions between GRS and h-PDI on BMI in a multivariate-adjusted model controlling for the covariates; higher (β, −2.51; 95% confidence interval [CI], −4.76 to −0.27; p = 0.02) or moderate (p = 0.054) h-PDI adherence was more strongly related to lower levels of BMI among individuals with higher GRS (T2 and T3) than those with lower GRS (T1). Furthermore, the genetic association with elevated BMI was stronger among participants with lower h-PDI than those with higher h-PDI (
Figure 1A). There was a similar pattern of GRS-h-PDI interaction on BFM and WC; higher h-PDI was associated with lower BFM (β, −4.88; 95% CI, −9.59 to −0.17; p = 0.04) and WC (β, −5.54; 95% CI, −11.23 to 0.14; p = 0.056) among people with higher GRS, as compared with those with lower GRS. In participants with low plant-based diet intake, the genetic influence on BFM and WC was greater (
Figure 1B and C). Among individuals with high GRS, moderate adherence to h-PDI (i.e., those in the T2 of h-PDI) significantly decreased WC levels (
Table 4).
Figure 1
The interaction between tertiles of h-PDI and GRS. (A) BMI, (B) BFM, and (C) WC. Data shown are mean ± standard error of the mean, T1 (< 51): n = 139, T2 (51–57): n = 97, and T3 (> 57): n = 141.
h-PDI, healthy plant-based diet index; GRS, genetic risk score; BMI, body mass index; BFM, body fat mass; WC, waist circumference.

Table 4The interaction between GRS and h-PDI on anthropometric body composition, blood parameters, and blood pressure
Table 4
|
Variable |
GRS |
h-PDI |
|
T1 |
T2 (51–57) |
T3 (> 57) |
|
Crude |
Model 1*
|
Crude |
Model 1*
|
|
β |
95% CI |
p |
β |
95% CI |
p |
β |
95% CI |
p |
β |
95% CI |
p |
|
BMI (kg/m2) |
T1 |
Reference |
|
|
|
|
|
|
|
|
|
|
|
|
|
T2 |
−2.64 |
−4.97 to −0.31 |
0.02
|
−2.41 |
−4.76 to −0.05 |
0.04
|
−2.29 |
−4.72 to 0.12 |
0.06
|
−1.94 |
−4.44 to 0.55 |
0.12 |
|
T3 |
−1.99 |
−4.12 to 0.14 |
0.06
|
−2.15 |
−4.36 to 0.04 |
0.054
|
−2.93 |
−5.10 to −0.76 |
0.008
|
−2.51 |
−4.76 to −0.27 |
0.02
|
|
Body composition |
|
|
|
|
|
|
|
|
|
|
|
|
|
|
|
WC (cm) |
T1 |
Reference |
|
|
|
|
|
|
|
|
|
|
|
|
|
T2 |
−6.70 |
−12.52 to −0.89 |
0.02
|
−5.09 |
−11.07 to 0.87 |
0.09†
|
−6.96 |
−13.00 to −0.93 |
0.02
|
−4.33 |
−10.66 to 2.00 |
0.18†
|
|
T3 |
−6.53 |
−11.86 to −1.19 |
0.01
|
−5.70 |
−11.29 to −0.12 |
0.04†
|
−7.86 |
−13.27 to −2.45 |
0.004
|
−5.54 |
−11.23 to 0.14 |
0.056†
|
|
WHR (ratio) |
T1 |
Reference |
|
|
|
|
|
|
|
|
|
|
|
|
|
T2 |
−0.02 |
−0.05 to 0.008 |
0.14 |
−0.01 |
−0.04 to 0.01 |
0.40 |
−0.02 |
−0.05 to 0.01 |
0.16 |
−0.006 |
−0.04 to 0.02 |
0.74 |
|
T3 |
−0.03 |
−0.06 to −0.003 |
0.03
|
−0.02 |
−0.05 to 0.008 |
0.14 |
−0.03 |
−0.06 to −0.002 |
0.03
|
−0.01 |
−0.04 to 0.01 |
0.26 |
|
BFM (kg) |
T1 |
Reference |
|
|
|
|
|
|
|
|
|
|
|
|
|
T2 |
−5.35 |
−10.20 to −0.51 |
0.03
|
−4.02 |
−8.96 to 0.91 |
0.11 |
−6.19 |
−11.22 to −1.16 |
0.01
|
−5.09 |
−10.33 to 0.14 |
0.05
|
|
T3 |
−4.22 |
−8.66 to 0.22 |
0.06
|
−3.71 |
−8.33 to 0.90 |
0.11 |
−6.27 |
−10.78 to −1.76 |
0.006
|
−4.88 |
−9.59 to −0.17 |
0.04
|
|
BF (%) |
T1 |
Reference |
|
|
|
|
|
|
|
|
|
|
|
|
|
T2 |
−1.97 |
−5.25 to 1.29 |
0.23 |
−1.02 |
−4.40 to 2.36 |
0.55 |
−2.31 |
−5.72 to 1.08 |
0.18 |
−2.10 |
−5.69 to 1.49 |
0.25 |
|
T3 |
−0.50 |
−3.51 to 2.50 |
0.74 |
0.22 |
−2.94 to 3.39 |
0.89 |
−1.96 |
−5.01 to 1.08 |
0.20 |
−1.15 |
−4.37 to 2.07 |
0.48 |
|
BMC (g) |
T1 |
Reference |
|
|
|
|
|
|
|
|
|
|
|
|
|
T2 |
−0.09 |
−0.30 to 0.11 |
0.38 |
−0.07 |
−0.29 to 0.14 |
0.51 |
−0.18 |
−0.40 to 0.03 |
0.10 |
−0.08 |
−0.32 to 0.14 |
0.47 |
|
T3 |
−0.14 |
−0.33 to 0.05 |
0.15 |
−0.13 |
−0.34 to 0.07 |
0.19 |
−0.12 |
−0.32 to 0.07 |
0.20 |
−0.05 |
−0.26 to 0.15 |
0.59 |
|
VFA (cm2) |
T1 |
Reference |
|
|
|
|
|
|
|
|
|
|
|
|
|
T2 |
−13.18 |
−36.11 to 9.74 |
0.26 |
−5.51 |
−28.94 to 17.91 |
0.64 |
−16.05 |
−39.86 to 7.75 |
0.18 |
−9.54 |
−34.39 to 15.30 |
0.45 |
|
T3 |
−17.06 |
−38.10 to 3.98 |
0.11 |
−11.86 |
−33.79 to 10.05 |
0.28 |
−25.40 |
−46.74 to −4.05 |
0.02
|
−17.09 |
−39.42 to 5.23 |
0.13 |
|
Blood pressure |
|
|
|
|
|
|
|
|
|
|
|
|
|
|
|
SBP (mmHg) |
T1 |
Reference |
|
|
|
|
|
|
|
|
|
|
|
|
|
T2 |
2.56 |
−7.46 to 12.59 |
0.61 |
3.03 |
−7.09 to 13.16 |
0.55 |
9.02 |
−1.19 to 19.24 |
0.08 |
9.44 |
−1.22 to 20.11 |
0.08 |
|
T3 |
−2.70 |
−11.92 to 6.51 |
0.56 |
−3.03 |
−12.52 to 6.45 |
0.53 |
0.77 |
−8.62 to 10.16 |
0.87 |
2.58 |
−7.10 to 12.26 |
0.60 |
|
DBP (mmHg) |
T1 |
Reference |
|
|
|
|
|
|
|
|
|
|
|
|
|
T2 |
−4.28 |
−11.35 to 2.77 |
0.23 |
−3.82 |
−10.86 to 3.21 |
0.28 |
4.98 |
−2.21 to 12.18 |
0.17 |
6.10 |
−1.31 to 13.51 |
0.10 |
|
T3 |
−5.28 |
−11.77 to 1.21 |
0.11 |
−3.03 |
−9.63 to 3.56 |
0.36 |
1.29 |
−5.32 to 7.91 |
0.70 |
2.21 |
−4.51 to 8.94 |
0.52 |
|
Blood sample |
|
|
|
|
|
|
|
|
|
|
|
|
|
|
|
FBS (mg/dL) |
T1 |
Reference |
|
|
|
|
|
|
|
|
|
|
|
|
|
T2 |
−1.24 |
−9.14 to 6.66 |
0.75 |
−1.04 |
−8.77 to 6.68 |
0.79 |
−4.24 |
−12.17 to 3.68 |
0.29 |
−4.49 |
−12.42 to 3.43 |
0.26 |
|
T3 |
2.29 |
−4.93 to 9.52 |
0.53 |
0.85 |
−6.26 to 7.96 |
0.81 |
−1.65 |
−8.89 to 5.59 |
0.65 |
−1.93 |
−9.14 to 5.27 |
0.60 |
|
Total cholesterol (g/dL) |
T1 |
Reference |
|
|
|
|
|
|
|
|
|
|
|
|
|
T2 |
−16.99 |
−45.84 to 11.85 |
0.24 |
−16.31 |
−45.19 to 12.57 |
0.26 |
0.81 |
−28.11 to 29.73 |
0.95 |
−1.51 |
−31.13 to 28.10 |
0.92 |
|
T3 |
9.62 |
−16.73 to 35.99 |
0.47 |
13.48 |
−13.09 to 40.06 |
0.32 |
20.67 |
−5.77 to 47.11 |
0.12 |
20.83 |
−6.10 to 47.76 |
0.13 |
|
TG (mg/dL) |
T1 |
Reference |
|
|
|
|
|
|
|
|
|
|
|
|
|
T2 |
−1.64 |
−58.66 to 55.36 |
0.95 |
2.65 |
−57.01 to 62.31 |
0.93 |
−7.89 |
−65.05 to 49.25 |
0.78 |
−9.14 |
−70.32 to 52.03 |
0.77 |
|
T3 |
−2.90 |
−55.00 to 49.19 |
0.91 |
8.96 |
−45.93 to 63.86 |
0.74 |
12.88 |
−39.37 to 65.13 |
0.62 |
10.75 |
−44.88 to 66.39 |
0.70 |
|
HDL (mg/dL) |
T1 |
Reference |
|
|
|
|
|
|
|
|
|
|
|
|
|
T2 |
1.02 |
−7.59 to 9.63 |
0.81 |
1.83 |
−7.00 to 10.67 |
0.68 |
6.77 |
−1.86 to 15.41 |
0.12 |
6.60 |
−2.45 to 15.67 |
0.15 |
|
T3 |
−0.51 |
−8.39 to 7.35 |
0.89 |
−0.93 |
−9.06 to 7.19 |
0.82 |
−1.21 |
−9.11 to 6.67 |
0.76 |
0.14 |
−8.09 to 8.39 |
0.97 |
|
LDL (mg/dL) |
T1 |
Reference |
|
|
|
|
|
|
|
|
|
|
|
|
|
T2 |
6.20 |
−13.06 to 25.48 |
0.52 |
6.23 |
−13.08 to 25.55 |
0.52 |
6.59 |
−12.73 to 25.91 |
0.50 |
4.93 |
−14.87 to 24.74 |
0.62 |
|
T3 |
11.39 |
−6.22 to 29.00 |
0.20 |
11.53 |
−6.23 to 29.31 |
0.20 |
11.04 |
−6.62 to 28.71 |
0.22 |
11.86 |
−6.15 to 29.87 |
0.19 |
|
hs-CRP (mg/L) |
T1 |
Reference |
|
|
|
|
|
|
|
|
|
|
|
|
|
T2 |
−3.08 |
−5.83 to −0.34 |
0.02
|
−3.49 |
−6.41 to −0.57 |
0.01
|
−2.89 |
−5.74 to −0.04 |
0.04
|
−3.42 |
−6.52 to −0.33 |
0.03
|
|
T3 |
−1.98 |
−4.49 to 0.53 |
0.12 |
−2.16 |
−4.89 to 0.55 |
0.11 |
−0.90 |
−3.45 to 1.65 |
0.49 |
−0.34 |
−3.12 to 2.43 |
0.80 |
|
HOMA index |
T1 |
Reference |
|
|
|
|
|
|
|
|
|
|
|
|
|
T2 |
−0.72 |
−1.75 to 0.30 |
0.17 |
−0.64 |
−1.72 to 0.44 |
0.25 |
0.10 |
−0.93 to 1.13 |
0.84 |
0.50 |
−0.61 to 1.62 |
0.37 |
|
T3 |
−0.37 |
−1.31 to 0.57 |
0.44 |
−0.36 |
−1.37 to 0.65 |
0.48 |
0.12 |
−0.82 to 1.06 |
0.79 |
0.23 |
−0.77 to 1.25 |
0.64 |
|
AST (IU/L) |
T1 |
Reference |
|
|
|
|
|
|
|
|
|
|
|
|
|
T2 |
−2.89 |
−8.88 to 3.08 |
0.34 |
−3.80 |
−9.94 to 2.34 |
0.22 |
0.71 |
−5.28 to 6.70 |
0.81 |
−1.11 |
−7.41 to 5.19 |
0.73 |
|
T3 |
−4.96 |
−10.42 to 0.50 |
0.07
|
−5.89 |
−11.54 to −0.23 |
0.04
|
−3.49 |
−8.98 to 1.98 |
0.21 |
−4.95 |
−10.68 to 0.78 |
0.09 |
|
ALT (IU/L) |
T1 |
Reference |
|
|
|
|
|
|
|
|
|
|
|
|
|
T2 |
−4.73 |
−15.31 to 5.84 |
0.38 |
−5.94 |
−16.91 to 5.02 |
0.28 |
−0.79 |
−11.40 to 9.81 |
0.88 |
−2.83 |
−14.08 to 8.41 |
0.62 |
|
T3 |
−7.18 |
−16.85 to 2.48 |
0.14 |
−9.64 |
−19.74 to 0.44 |
0.06
|
−7.75 |
−17.44 to 1.94 |
0.11 |
−10.14 |
−20.37 to 0.08 |
0.05
|
|
Insulin (mIU/mL) |
T1 |
Reference |
|
|
|
|
|
|
|
|
|
|
|
|
|
T2 |
−0.07 |
−0.26 to 0.10 |
0.40 |
−0.08 |
−0.27 to 0.10 |
0.37 |
−0.02 |
−0.21 to 0.15 |
0.76 |
−0.06 |
−0.26 to 0.13 |
0.51 |
|
T3 |
−0.15 |
−0.32 to 0.01 |
0.07
|
−0.19 |
−0.37 to −0.02 |
0.02
|
−0.15 |
−0.32 to 0.01 |
0.08 |
−0.18 |
−0.36 to −0.009 |
0.04
|
|
MCP-1 (ng/mL) |
T1 |
Reference |
|
|
|
|
|
|
|
|
|
|
|
|
|
T2 |
6.81 |
−75.26 to 88.88 |
0.87 |
−2.48 |
−80.36 to 75.38 |
0.95 |
−44.58 |
−128.06 to 38.88 |
0.29 |
−44.57 |
−125.25 to 36.09 |
0.27 |
|
T3 |
−31.52 |
−104.54 to 41.49 |
0.39 |
−33.74 |
−104.13 to 36.64 |
0.34 |
−24.23 |
−98.52 to 50.06 |
0.52 |
−27.96 |
−98.95 to 43.02 |
0.44 |
|
Galectin 3 (ng/mL) |
T1 |
Reference |
|
|
|
|
|
|
|
|
|
|
|
|
|
T2 |
−5.15 |
−15.51 to 5.20 |
0.32 |
−7.64 |
−18.69 to 3.39 |
0.17 |
−7.42 |
−19.00 to 4.16 |
0.20 |
−9.16 |
−21.22 to 2.90 |
0.13 |
|
T3 |
−6.11 |
−15.63 to 3.41 |
0.20 |
−8.36 |
−18.78 to 2.05 |
0.11 |
−1.10 |
−11.06 to 8.85 |
0.82 |
−2.72 |
−13.21 to 7.76 |
0.61 |
|
PAI-1 (ng/mL) |
T1 |
Reference |
|
|
|
|
|
|
|
|
|
|
|
|
|
T2 |
−2.07 |
−30.13 to 25.99 |
0.88 |
−9.88 |
−37.08 to 17.31 |
0.47 |
−21.42 |
−49.43 to 6.58 |
0.13 |
−28.27 |
−55.25 to −1.30 |
0.04
|
|
T3 |
−13.49 |
−40.73 to 13.73 |
0.33 |
−14.58 |
−41.05 to 11.88 |
0.28 |
−32.78 |
−59.58 to −5.98 |
0.01 |
−41.73 |
−67.75 to −15.72 |
0.002
|
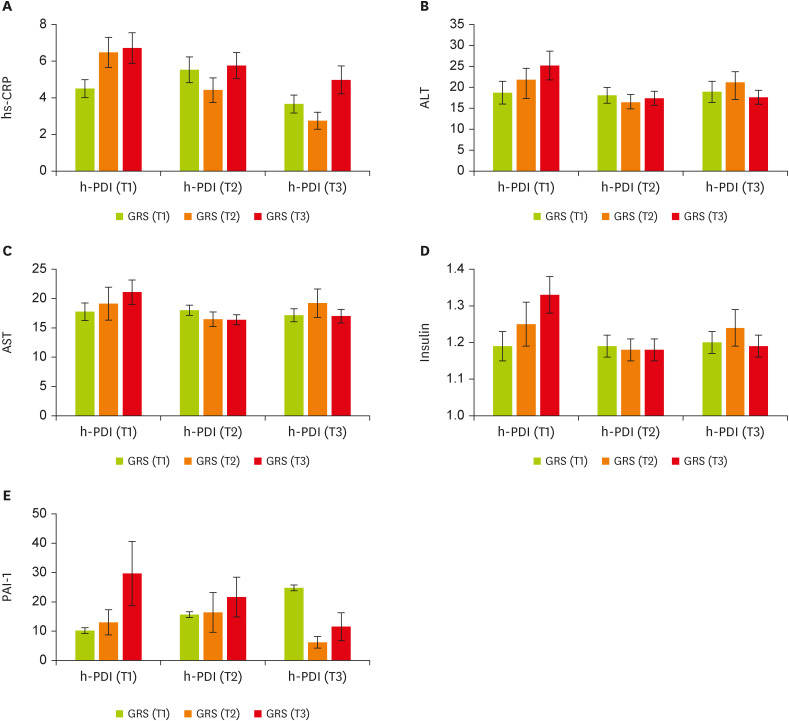
We then conducted analyses to examine whether there was significant evidence of GRS × h-PDI interactions on cardiometabolic markers. There is a significant gene-diet interaction for healthful plant-derived diets and GRS on hs-CRP (β, −3.42; 95% CI, −6.52 to −0.33; p = 0.03;
Figure 2A), aspartate aminotransferase (AST) (β, −5.89; 95% CI, −11.54 to −0.23; p = 0.04;
Figure 2C), alanine transaminase (ALT) (β, −10.14; 95% CI, −20.37 to 0.08; p = 0.05;
Figure 2B), insulin (β, −0.18; 95% CI, −0.36 to −0.009; p = 0.04;
Figure 2D), and PAI-1 (β, −41.73; 95% CI, −67.75 to −15.72; p = 0.002;
Figure 2E) in the adjusted model (adjusting for age, energy intake, physical activity, and BMI). In particular, participants placed in the second tertile of the GRS were characterized by lower hs-CRP when they had the highest (p = 0.03) and moderate (p = 0.01) following h-PDI compared to the first tertile. Women in T2 of the h-PDI and the top tertile of GRS had significantly lower AST and insulin concentrations than those in T1 of the same pattern and genetic score, whereas individuals in the last tertile of h-PDI and GRS had lower significant levels of ALT, insulin, and PAI-1. For all the aforementioned markers, greater h-PDI adherence was observed among people with moderate or high GRS compared with those with lower GRS. Decreasing trends were observed (
Figure 2). No significant interactions were found between GRS and healthy-PDI for other metabolic-related traits (p > 0.05;
Table 4).
Figure 2
The interaction between tertiles of h-PDI and GRS. (A) hs-CRP, (B) ALT, (C) AST, (D) insulin, (E) PAI-1. Data shown are mean ± standard error of the mean.
h-PDI, healthy plant-based diet index; GRS, genetic risk score; hs-CRP, high-sensitivity C-reactive protein; ALT, alanine transaminase; AST, aspartate aminotransferase; PAI-1, plasminogen activator inhibitor 1.

DISCUSSION
This cross-sectional study aimed to investigate the interaction between the healthful-PDI and BMI-GRS based on MC4R (rs17782313), CAV-1 (rs38 07992), and Cry1 (rs2287161) on cardiometabolic traits in overweight and obese women. We indicated that plant-based dietary patterns evaluated by h-PDI regarding genetic susceptibility were predictive of cardiometabolic abnormalities in our population. Our findings highlight the importance that individuals at higher or moderate risk genetically may be more responsive to the benefits of plant-based dietary patterns to modify cardiometabolic risk factors.
Our findings showed a negative interaction between greater GRS with both high and moderate h-PDI on BMI and WC compared with lower GRS. Other novel significant inverse interactions were found between higher h-PDI adherence and GRS when placed in the second and last tertiles, compared with lower GRS on BFM. Our results were in line with previous studies regarding genetic effects on obesity and weight gain [
36,
51,
52] and demonstrated that following healthy plant-based dietary patterns attenuated genetic risks of BMI [
10], WC, and BFM. Similarly, the interactions between the Mediterranean diet and obesity-GRS on BMI and WC showed tendencies to decrease [
53]. In comparison to other diet indices (such as Dietary Approaches to Stop Hypertension [DASH], Alternate Healthy Eating Index, and Mediterranean diet scores), h-PDI is based on several food items, including healthy and less healthy plant-derived foods, to capture synergistic and graded intakes of different food items. Moreover, some components in the h-PDI, such as sugar-sweetened beverages, coffee, and saturated fat, are thought to be involved in genetic predisposition to obesity [
54,
55,
56,
57,
58,
59]. Therefore, the observed strong GRS-h-PDI interactions on the reduced trend of BMI and other body composition parameters, including WC and BFM, might be related to lower intakes of less healthy plant-based foods and animal foods, low energy density [
60], and promoting the gut microbiota balance due to greater dietary fiber intake [
61]. Furthermore, plant bioactives via regulating non-shivering thermogenesis and energy expenditure may be involved [
62,
63].
An earlier observational study found a significant GRS-h-PDI interaction on lipid markers [
54]. Accordingly, healthier plant-based diets have been shown to be beneficial for controlling HDL cholesterol and lowering serum TC levels [
24,
52,
64,
65], whereas the results for TGs remain controversial [
64]. No significant interaction was observed in terms of lipid markers in our study, though. Concerning AST and ALT, we found that women with elevated scores of GRS with high and moderate healthy plant-based Concerning AST and ALT, we found that women with elevated scores of GRS with high and moderate healthy plant-based diet adherence had lower levels of AST and ALT. While, Abaj et al. have claimed that A-allele carriers of the CAV-1 polymorphism (rs3807992) who follow an unhealthy dietary pattern have a statistically significant lower AST, probably because the particular region of a candidate gene for caffeine intake is near to the CAV-1 gene [
24,
66]. In this vein, we have suggested a possible interaction between greater GRS and high caffeine intake in our dietary pattern with lower levels of AST. On the other hand, we also found negative significant GRS-h-PDI interactions on hs-CRP and insulin concentrations. In support of our findings, a meta-analysis underscored the effect of plant-based diets on decreasing concentrations of inflammatory biomarkers, including hs-CRP, regardless of genetic predisposition. A similar association was observed between CAV-1 variants at rs3807992 and healthy dietary intake in terms of hs-CRP concentrations [
24]. Some possible biological mechanisms have been proposed that following plant-based dietary patterns potentially elicits favorable effects and improves profiles of inflammatory biomarkers (CRP and IL-6) [
67,
68,
69] through energy restriction, lowering glycemic load, and reduced oxidative stress due to lower saturated fatty acids and higher polyunsaturated fatty acids [
70,
71]. Concordant with our results, it has been reported that people with higher dietary total antioxidant capacity have appreciably lower circulating insulin concentrations [
72]. As a matter of fact, certain components of plant-based diets, such as vegetables and fruits, with the antioxidant functions of phytochemicals, increase the sensitivity of insulin [
73] and might contribute to the observed strong GRS-h-PDI interactions on low insulin levels. Similar to our findings, plant-derived foods with a low glycemic index may play a potential role in reducing PAI-1 and platelet aggregation [
74]. Another study showed no significant association between CAV-1 polymorphism and PAI-1 [
24]. Overall, in the literature, no substantially significant interactions between GRS and h-PDI were identified for the rest of the variables.
Interestingly, it has been reported that people at higher genetic risk of obesity may obtain more benefit from lowering cardiometabolic risk factors through elevated intake of healthy plant foods, irrespective of the presence of baseline obesity [
52,
75]. Relatedly, based on the results of the PREDIMED trial, following a plant-food-rich dietary pattern significantly decreased the risk of CVD mortality [
76]. Moreover, vegetarian diets were also associated with lower CVD mortality in the Adventist Health Study [
77].
As such, these findings are believed to underlie prevention of CVD risks since early life and provide important evidence to support that greater adherence to plant-based diets among participants with higher GRS, compared with those with lower GRS, may have beneficial effects. As strength, it is important to note that we assessed individual food items to evaluate the h-PDI adherence based on different food groups. Also, our study only included overweight and obese otherwise healthy women. Thus, no known medications or illness with the possibility to affect inflammatory process and cardiometabolic diseases such as hormone therapy existed. Nonetheless, several limitations should be considered in the interpretation of this study. Due to cross-sectional design of the study, it was impossible to draw conclusive associations between GRS and h-PDI interactions with cardiometabolic risk factors. Moreover, GRS based on BMI linked genetic markers employed in this study is probably unable to estimate the true genetic impact on cardiometabolic risk factors since a limited number of SNPs were included. Furthermore, the use of self-reported FFQ for dietary assessment is prone to measurement error. Finally, the current study with small sample size was only done among women, therefore, findings are not generalizable to men.
CONCLUSION
The involvement of h-PDI appears to be a protective factor against cardiometabolic risk factors in overweight and obese women with increased GRS. However, as a result of the limited literature conducted in this regard, large prospective studies in different populations are required to confirm these findings.
Tehran University of Medical Sciences and Health Serviceshttps://doi.org/10.13039/501100004484
970316141144
NOTES
-
Funding: This study was supported by the Tehran University of Medical Sciences (TUMS), Tehran, Iran (code 970316141144).
-
Conflict of Interest: The authors declare that they have no competing interests.
-
Author Contributions:
Conceptualization: Gholami F, Mirzaei K.
Data curation: Gholami F, Shiraseb F.
Writing - original draft: Gholami F, Samadi M, Rasaei N.
Writing - review & editing: Keshavarz SA, Bahrampour N, Javdan G.
ACKNOWLEDGEMENTS
We would like to acknowledge the Tehran University of Medical Sciences, Tehran, Iran, for the fund.
REFERENCES
- 1. Roth GA, Johnson C, Abajobir A, Abd-Allah F, Abera SF, Abyu G, Ahmed M, Aksut B, Alam T, Alam K, Alla F, Alvis-Guzman N, Amrock S, Ansari H, Ärnlöv J, Asayesh H, Atey TM, Avila-Burgos L, Awasthi A, Banerjee A, Barac A, Bärnighausen T, Barregard L, Bedi N, Belay Ketema E, Bennett D, Berhe G, Bhutta Z, Bitew S, Carapetis J, Carrero JJ, Malta DC, Castañeda-Orjuela CA, Castillo-Rivas J, Catalá-López F, Choi JY, Christensen H, Cirillo M, Cooper L Jr, Criqui M, Cundiff D, Damasceno A, Dandona L, Dandona R, Davletov K, Dharmaratne S, Dorairaj P, Dubey M, Ehrenkranz R, El Sayed Zaki M, Faraon EJA, Esteghamati A, Farid T, Farvid M, Feigin V, Ding EL, Fowkes G, Gebrehiwot T, Gillum R, Gold A, Gona P, Gupta R, Habtewold TD, Hafezi-Nejad N, Hailu T, Hailu GB, Hankey G, Hassen HY, Abate KH, Havmoeller R, Hay SI, Horino M, Hotez PJ, Jacobsen K, James S, Javanbakht M, Jeemon P, John D, Jonas J, Kalkonde Y, Karimkhani C, Kasaeian A, Khader Y, Khan A, Khang YH, Khera S, Khoja AT, Khubchandani J, Kim D, Kolte D, Kosen S, Krohn KJ, Kumar GA, Kwan GF, Lal DK, Larsson A, Linn S, Lopez A, Lotufo PA, El Razek HMA, Malekzadeh R, Mazidi M, Meier T, Meles KG, Mensah G, Meretoja A, Mezgebe H, Miller T, Mirrakhimov E, Mohammed S, Moran AE, Musa KI, Narula J, Neal B, Ngalesoni F, Nguyen G, Obermeyer CM, Owolabi M, Patton G, Pedro J, Qato D, Qorbani M, Rahimi K, Rai RK, Rawaf S, Ribeiro A, Safiri S, Salomon JA, Santos I, Santric Milicevic M, Sartorius B, Schutte A, Sepanlou S, Shaikh MA, Shin MJ, Shishehbor M, Shore H, Silva DAS, Sobngwi E, Stranges S, Swaminathan S, Tabarés-Seisdedos R, Tadele Atnafu N, Tesfay F, Thakur JS, Thrift A, Topor-Madry R, Truelsen T, Tyrovolas S, Ukwaja KN, Uthman O, Vasankari T, Vlassov V, Vollset SE, Wakayo T, Watkins D, Weintraub R, Werdecker A, Westerman R, Wiysonge CS, Wolfe C, Workicho A, Xu G, Yano Y, Yip P, Yonemoto N, Younis M, Yu C, Vos T, Naghavi M, Murray C. Global, regional, and national burden of cardiovascular diseases for 10 causes, 1990 to 2015. J Am Coll Cardiol 2017;70:1-25.
- 2. Mensah GA, Roth GA, Fuster V. The global burden of cardiovascular diseases and risk factors: 2020 and beyond. J Am Coll Cardiol 2019;74:2529-2532.
- 3. Cannon CP. Cardiovascular disease and modifiable cardiometabolic risk factors. Clin Cornerstone 2007;8:11-28.
- 4. World Health Organization (WHO). Global status report on noncommunicable diseases. Geneva: WHO; 2014.
- 5. Sarrafzadegan N, Baghaei A, Sadri G, Kelishadi R, Malekafzali H, Boshtam M, Amani A, Rabie K, Moatarian A, Rezaeiashtiani A, Paradis G, O’Loughlin J. Isfahan healthy heart program: evaluation of comprehensive, community-based interventions for non-communicable disease prevention. Prev Control 2006;2:73-84.
- 6. Myers J, McAuley P, Lavie CJ, Despres JP, Arena R, Kokkinos P. Physical activity and cardiorespiratory fitness as major markers of cardiovascular risk: their independent and interwoven importance to health status. Prog Cardiovasc Dis 2015;57:306-314.
- 7. Han TS, van Leer EM, Seidell JC, Lean ME. Waist circumference action levels in the identification of cardiovascular risk factors: prevalence study in a random sample. BMJ 1995;311:1401-1405.
- 8. McMillan DC, Sattar N, McArdle CS. ABC of obesity. Obesity and cancer. BMJ 2006;333:1109-1111.
- 9. Whitlock G, Lewington S, Sherliker P, Clarke R, Emberson J, Halsey J, Qizilbash N, Collins R, Peto R. Prospective Studies Collaboration. Body-mass index and cause-specific mortality in 900 000 adults: collaborative analyses of 57 prospective studies. Lancet 2009;373:1083-1096.
- 10. Heianza Y, Zhou T, Sun D, Hu FB, Manson JE, Qi L. Genetic susceptibility, plant-based dietary patterns, and risk of cardiovascular disease. Am J Clin Nutr 2020;112:220-228.
- 11. Montagnese C, Santarpia L, Buonifacio M, Nardelli A, Caldara AR, Silvestri E, Contaldo F, Pasanisi F. European food-based dietary guidelines: a comparison and update. Nutrition 2015;31:908-915.
- 12. Bolori P, Setaysh L, Rasaei N, Jarrahi F, Yekaninejad MS, Mirzaei K. Adherence to a healthy plant diet may reduce inflammatory factors in obese and overweight women-a cross-sectional study. Diabetes Metab Syndr 2019;13:2795-2802.
- 13. Satija A, Bhupathiraju SN, Rimm EB, Spiegelman D, Chiuve SE, Borgi L, Willett WC, Manson JE, Sun Q, Hu FB. Plant-based dietary patterns and incidence of type 2 diabetes in US men and women: results from three prospective cohort studies. PLoS Med 2016;13:e1002039.
- 14. Satija A, Bhupathiraju SN, Spiegelman D, Chiuve SE, Manson JE, Willett W, Rexrode KM, Rimm EB, Hu FB. Healthful and unhealthful plant-based diets and the risk of coronary heart disease in US adults. J Am Coll Cardiol 2017;70:411-422.
- 15. Shahinfar H, Amini MR, Payandeh N, Naghshi S, Sheikhhossein F, Djafarian K, Shab-Bidar S. The link between plant-based diet indices with biochemical markers of bone turn over, inflammation, and insulin in Iranian older adults. Food Sci Nutr 2021;9:3000-3014.
- 16. Yarizadeh H, Setayesh L, Majidi N, Rasaei N, Mehranfar S, Ebrahimi R, et al. Nutrient patterns and their relation to obesity and metabolic syndrome in Iranian overweight and obese adult women. Eat Weight Disord 2022;27:1327-1337.
- 17. Inouye M, Abraham G, Nelson CP, Wood AM, Sweeting MJ, Dudbridge F, Lai FY, Kaptoge S, Brozynska M, Wang T, Ye S, Webb TR, Rutter MK, Tzoulaki I, Patel RS, Loos RJF, Keavney B, Hemingway H, Thompson J, Watkins H, Deloukas P, Di Angelantonio E, Butterworth AS, Danesh J, Samani NJ. UK Biobank CardioMetabolic Consortium CHD Working Group. Genomic risk prediction of coronary artery disease in 480,000 adults: implications for primary prevention. J Am Coll Cardiol 2018;72:1883-1893.
- 18. Abraham G, Havulinna AS, Bhalala OG, Byars SG, De Livera AM, Yetukuri L, Tikkanen E, Perola M, Schunkert H, Sijbrands EJ, Palotie A, Samani NJ, Salomaa V, Ripatti S, Inouye M. Genomic prediction of coronary heart disease. Eur Heart J 2016;37:3267-3278.
- 19. Dudbridge F. Power and predictive accuracy of polygenic risk scores. PLoS Genet 2013;9:e1003348.
- 20. Thorn H, Stenkula KG, Karlsson M, Ortegren U, Nystrom FH, Gustavsson J, Stralfors P. Cell surface orifices of caveolae and localization of caveolin to the necks of caveolae in adipocytes. Mol Biol Cell 2003;14:3967-3976.
- 21. Fernández-Hernando C, Yu J, Dávalos A, Prendergast J, Sessa WC. Endothelial-specific overexpression of caveolin-1 accelerates atherosclerosis in apolipoprotein E-deficient mice. Am J Pathol 2010;177:998-1003.
- 22. Frank PG, Pavlides S, Cheung MW, Daumer K, Lisanti MP. Role of caveolin-1 in the regulation of lipoprotein metabolism. Am J Physiol Cell Physiol 2008;295:C242-C248.
- 23. Pojoga LH, Underwood PC, Goodarzi MO, Williams JS, Adler GK, Jeunemaitre X, Hopkins PN, Raby BA, Lasky-Su J, Sun B, Cui J, Guo X, Taylor KD, Chen YD, Xiang A, Raffel LJ, Buchanan TA, Rotter JI, Williams GH. Variants of the caveolin-1 gene: a translational investigation linking insulin resistance and hypertension. J Clin Endocrinol Metab 2011;96:E1288-E1292.
- 24. Abaj F, Koohdani F, Rafiee M, Alvandi E, Yekaninejad MS, Mirzaei K. Interactions between caveolin-1 (rs3807992) polymorphism and major dietary patterns on cardio-metabolic risk factors among obese and overweight women. BMC Endocr Disord 2021;21:138.
- 25. Khatibi N, Mirzababaei A, Shiraseb F, Abaj F, Koohdani F, Mirzaei K. Interactions between caveolin 1 polymorphism and the Mediterranean and Mediterranean-DASH Intervention for Neurodegenerative Delay diet (MIND) diet on metabolic dyslipidemia in overweight and obese adult women: a cross-sectional study. BMC Res Notes 2021;14:364.
- 26. Grant SF, Bradfield JP, Zhang H, Wang K, Kim CE, Annaiah K, Santa E, Glessner JT, Thomas K, Garris M, Frackelton EC, Otieno FG, Shaner JL, Smith RM, Imielinski M, Chiavacci RM, Li M, Berkowitz RI, Hakonarson H. Investigation of the locus near MC4R with childhood obesity in Americans of European and African ancestry. Obesity (Silver Spring) 2009;17:1461-1465.
- 27. Sun Y, Sun J, Wu J, Yang M. Combined effects of FTO rs9939609 and MC4R rs17782313 on elevated nocturnal blood pressure in the Chinese Han population. Cardiovasc J S Afr 2016;27:21-24.
- 28. Tschritter O, Haupt A, Preissl H, Ketterer C, Hennige AM, Sartorius T, Machicao F, Fritsche A, Häring HU. An obesity risk SNP (rs17782313) near the MC4R gene is associated with cerebrocortical insulin resistance in humans. J Obes 2011;2011:283153.
- 29. Chambers JC, Elliott P, Zabaneh D, Zhang W, Li Y, Froguel P, Balding D, Scott J, Kooner JS. Common genetic variation near MC4R is associated with waist circumference and insulin resistance. Nat Genet 2008;40:716-718.
- 30. Xi B, Chandak GR, Shen Y, Wang Q, Zhou D. Association between common polymorphism near the MC4R gene and obesity risk: a systematic review and meta-analysis. PLoS One 2012;7:e45731.
- 31. Zhang EE, Liu Y, Dentin R, Pongsawakul PY, Liu AC, Hirota T, Nusinow DA, Sun X, Landais S, Kodama Y, Brenner DA, Montminy M, Kay SA. Cryptochrome mediates circadian regulation of cAMP signaling and hepatic gluconeogenesis. Nat Med 2010;16:1152-1156.
- 32. Hatori M, Panda S. CRY links the circadian clock and CREB-mediated gluconeogenesis. Cell Res 2010;20:1285-1288.
- 33. Dashti HS, Smith CE, Lee YC, Parnell LD, Lai CQ, Arnett DK, Ordovás JM, Garaulet M. CRY1 circadian gene variant interacts with carbohydrate intake for insulin resistance in two independent populations: Mediterranean and North American. Chronobiol Int 2014;31:660-667.
- 34. Yengo L, Sidorenko J, Kemper KE, Zheng Z, Wood AR, Weedon MN, Frayling TM, Hirschhorn J, Yang J, Visscher PM. GIANT Consortium. Meta-analysis of genome-wide association studies for height and body mass index in ~700000 individuals of European ancestry. Hum Mol Genet 2018;27:3641-3649.
- 35. Turcot V, Lu Y, Highland HM, et al. Protein-altering variants associated with body mass index implicate pathways that control energy intake and expenditure in obesity. Nat Genet 2018;50:26-41.
- 36. Wang T, Heianza Y, Sun D, Huang T, Ma W, Rimm EB, Manson JE, Hu FB, Willett WC, Qi L. Improving adherence to healthy dietary patterns, genetic risk, and long term weight gain: gene-diet interaction analysis in two prospective cohort studies. BMJ 2018;360:j5644.
- 37. Zheng Y, Li Y, Huang T, Cheng HL, Campos H, Qi L. Sugar-sweetened beverage intake, chromosome 9p21 variants, and risk of myocardial infarction in Hispanics. Am J Clin Nutr 2016;103:1179-1184.
- 38. Hindy G, Ericson U, Hamrefors V, Drake I, Wirfält E, Melander O, Orho-Melander M. The chromosome 9p21 variant interacts with vegetable and wine intake to influence the risk of cardiovascular disease: a population based cohort study. BMC Med Genet 2014;15:1220.
- 39. TANITA Corporation. Body composition analyzer BC-418: instruction manual. Tokyo, Japan: TANITA Corporation; 2015.
- 40. Aadahl M, Jørgensen T. Validation of a new self-report instrument for measuring physical activity. Med Sci Sports Exerc 2003;35:1196-1202.
- 41. Mirzaei K, Hossein-Nezhad A, Keshavarz SA, Eshaghi SM, Koohdani F, Saboor-Yaraghi AA, Hosseini S, Tootee A, Djalali M. Insulin resistance via modification of PGC1α function identifying a possible preventive role of vitamin D analogues in chronic inflammatory state of obesity. A double blind clinical trial study. Minerva Med 2014;105:63-78.
- 42. Mirmiran P, Esfahani FH, Mehrabi Y, Hedayati M, Azizi F. Reliability and relative validity of an FFQ for nutrients in the Tehran lipid and glucose study. Public Health Nutr 2010;13:654-662.
- 43. Ghaffarpour M, Houshiar-Rad A, Kianfar H. The manual for household measures, cooking yields factors and edible portion of food. Tehran Nashre Olume Keshavarzy 1999;7:42-58.
- 44. Miller SA, Dykes DD, Polesky HF. MWer S. A simple salting out procedure for extracting DNA from human nucleated cells. Nucleic Acids Res 1988;16:1215.
- 45. Myakishev MV, Khripin Y, Hu S, Hamer DH. High-throughput SNP genotyping by allele-specific PCR with universal energy-transfer-labeled primers. Genome Res 2001;11:163-169.
- 46. Zlatohlavek L, Vrablik M, Motykova E, Ceska R, Vasickova L, Dlouha D, Hubacek JA. FTO and MC4R gene variants determine BMI changes in children after intensive lifestyle intervention. Clin Biochem 2013;46:313-316.
- 47. Yarizadeh HM, Ghodoosi N, Pooyan S, Djafarian KC, Clark C, Mirzaei K. The interaction between the dietary inflammatory index and MC4R gene variants on cardiovascular risk factors. Clin Nutr 2021;40:488-495.
- 48. Tangestani H, Emamat H, Yekaninejad MS, Keshavarz SA, Mirzaei K. Variants in circadian rhythm gene Cry1 interacts with healthy dietary pattern for serum leptin levels: a cross-sectional study. Clin Nutr Res 2021;10:48-58.
- 49. Yu K, Li L, Zhang L, Guo L, Wang C. Association between MC4R rs17782313 genotype and obesity: a meta-analysis. Gene 2020;733:144372.
- 50. Miranda AM, Steluti J, Norde MM, Fisberg RM, Marchioni DM. The association between genetic risk score and blood pressure is modified by coffee consumption: gene-diet interaction analysis in a population-based study. Clin Nutr 2019;38:1721-1728.
- 51. Ding M, Ellervik C, Huang T, Jensen MK, Curhan GC, Pasquale LR, Kang JH, Wiggs JL, Hunter DJ, Willett WC, Rimm EB, Kraft P, Chasman DI, Qi L, Hu FB, Qi Q. Diet quality and genetic association with body mass index: results from 3 observational studies. Am J Clin Nutr 2018;108:1291-1300.
- 52. Heianza Y, Zhou T, Sun D, Hu FB, Qi L. Healthful plant-based dietary patterns, genetic risk of obesity, and cardiovascular risk in the UK biobank study. Clin Nutr 2021;40:4694-4701.
- 53. Seral-Cortes M, Sabroso-Lasa S, De Miguel-Etayo P, Gonzalez-Gross M, Gesteiro E, Molina-Hidalgo C, De Henauw S, Erhardt É, Censi L, Manios Y, Karaglani E, Widhalm K, Kafatos A, Beghin L, Meirhaeghe A, Salazar-Tortosa D, Ruiz JR, Moreno LA, Esteban LM, Labayen I. Interaction effect of the Mediterranean diet and an obesity genetic risk score on adiposity and metabolic syndrome in adolescents: the HELENA study. Nutrients 2020;12:3841.
- 54. Qi Q, Chu AY, Kang JH, Jensen MK, Curhan GC, Pasquale LR, Ridker PM, Hunter DJ, Willett WC, Rimm EB, Chasman DI, Hu FB, Qi L. Sugar-sweetened beverages and genetic risk of obesity. N Engl J Med 2012;367:1387-1396.
- 55. Tyrrell J, Wood AR, Ames RM, Yaghootkar H, Beaumont RN, Jones SE, Tuke MA, Ruth KS, Freathy RM, Davey Smith G, Joost S, Guessous I, Murray A, Strachan DP, Kutalik Z, Weedon MN, Frayling TM. Gene-obesogenic environment interactions in the UK Biobank study. Int J Epidemiol 2017;46:559-575.
- 56. Olsen NJ, Ängquist L, Larsen SC, Linneberg A, Skaaby T, Husemoen LL, Toft U, Tjønneland A, Halkjær J, Hansen T, Pedersen O, Overvad K, Ahluwalia TS, Sørensen TI, Heitmann BL. Interactions between genetic variants associated with adiposity traits and soft drinks in relation to longitudinal changes in body weight and waist circumference. Am J Clin Nutr 2016;104:816-826.
- 57. Wang T, Huang T, Kang JH, Zheng Y, Jensen MK, Wiggs JL, Pasquale LR, Fuchs CS, Campos H, Rimm EB, Willett WC, Hu FB, Qi L. Habitual coffee consumption and genetic predisposition to obesity: gene-diet interaction analyses in three US prospective studies. BMC Med 2017;15:97.
- 58. Casas-Agustench P, Arnett DK, Smith CE, Lai CQ, Parnell LD, Borecki IB, Frazier-Wood AC, Allison M, Chen YD, Taylor KD, Rich SS, Rotter JI, Lee YC, Ordovás JM. Saturated fat intake modulates the association between an obesity genetic risk score and body mass index in two US populations. J Acad Nutr Diet 2014;114:1954-1966.
- 59. Celis-Morales CA, Lyall DM, Gray SR, Steell L, Anderson J, Iliodromiti S, Welsh P, Guo Y, Petermann F, Mackay DF, Bailey MES, Pell JP, Gill JMR, Sattar N. Dietary fat and total energy intake modifies the association of genetic profile risk score on obesity: evidence from 48 170 UK Biobank participants. Int J Obes 2017;41:1761-1768.
- 60. Calpe-Berdiel L, Escolà-Gil JC, Blanco-Vaca F. New insights into the molecular actions of plant sterols and stanols in cholesterol metabolism. Atherosclerosis 2009;203:18-31.
- 61. Park S, Yang HJ, Kim MJ, Hur HJ, Kim SH, Kim MS. Interactions between polygenic risk scores, dietary pattern, and menarche age with the obesity risk in a large hospital-based cohort. Nutrients 2021;13:3772.
- 62. Kang HW, Lee SG, Otieno D, Ha K. Flavonoids, potential bioactive compounds, and non-shivering thermogenesis. Nutrients 2018;10:1168.
- 63. Mele L, Bidault G, Mena P, Crozier A, Brighenti F, Vidal-Puig A, Del Rio D. Dietary (poly)phenols, brown adipose tissue activation, and energy expenditure: a narrative review. Adv Nutr 2017;8:694-704.
- 64. Wang F, Zheng J, Yang B, Jiang J, Fu Y, Li D. Effects of vegetarian diets on blood lipids: a systematic review and meta-analysis of randomized controlled trials. J Am Heart Assoc 2015;4:e002408.
- 65. Schwingshackl L, Hoffmann G, Iqbal K, Schwedhelm C, Boeing H. Food groups and intermediate disease markers: a systematic review and network meta-analysis of randomized trials. Am J Clin Nutr 2018;108:576-586.
- 66. Haddad D, Al Madhoun A, Nizam R, Al-Mulla F. Role of caveolin-1 in diabetes and its complications. Oxid Med Cell Longev 2020;2020:9761539.
- 67. Eichelmann F, Schwingshackl L, Fedirko V, Aleksandrova K. Effect of plant-based diets on obesity-related inflammatory profiles: a systematic review and meta-analysis of intervention trials. Obes Rev 2016;17:1067-1079.
- 68. Qi L, Hu FB. Dietary glycemic load, whole grains, and systemic inflammation in diabetes: the epidemiological evidence. Curr Opin Lipidol 2007;18:3-8.
- 69. Schwingshackl L, Hoffmann G. Long-term effects of low glycemic index/load vs. high glycemic index/load diets on parameters of obesity and obesity-associated risks: a systematic review and meta-analysis. Nutr Metab Cardiovasc Dis 2013;23:699-706.
- 70. Lüscher TF. Ageing, inflammation, and oxidative stress: final common pathways of cardiovascular disease. Eur Heart J 2015;36:3381-3383.
- 71. Nassar AL, Marot LP, Ovidio PP, Castro GS, Jordão AA Jr. Oxidative stress and fatty acid profile in Wistar rats subjected to acute food restriction and refeeding with high-fat diets. Acta Cir Bras 2014;29:178-185.
- 72. Galarregui C, Zulet MÁ, Cantero I, Marín-Alejandre BA, Monreal JI, Elorz M, Benito-Boillos A, Herrero JI, Tur JA, Abete I, Martínez JA. Interplay of glycemic index, glycemic load, and dietary antioxidant capacity with insulin resistance in subjects with a cardiometabolic risk profile. Int J Mol Sci 2018;19:3662.
- 73. Kahleova H, Tura A, Hill M, Holubkov R, Barnard ND. A plant-based dietary intervention improves beta-cell function and insulin resistance in overweight adults: a 16-week randomized clinical trial. Nutrients 2018;10:189.
- 74. McEwen BJ. The influence of diet and nutrients on platelet function. Semin Thromb Hemost 2014;40:214-226.
- 75. Lyall DM, Celis-Morales C, Ward J, Iliodromiti S, Anderson JJ, Gill JMR, Smith DJ, Ntuk UE, Mackay DF, Holmes MV, Sattar N, Pell JP. Association of body mass index with cardiometabolic disease in the UK biobank: a mendelian randomization study. JAMA Cardiol 2017;2:882-889.
- 76. Martínez-González MA, Sánchez-Tainta A, Corella D, Salas-Salvadó J, Ros E, Arós F, Gómez-Gracia E, Fiol M, Lamuela-Raventós RM, Schröder H, Lapetra J, Serra-Majem L, Pinto X, Ruiz-Gutierrez V, Estruch R. PREDIMED Group. A provegetarian food pattern and reduction in total mortality in the Prevención con Dieta Mediterránea (PREDIMED) study. Am J Clin Nutr 2014;100(Suppl 1):320S-328S.
- 77. Orlich MJ, Singh PN, Sabaté J, Jaceldo-Siegl K, Fan J, Knutsen S, Beeson WL, Fraser GE. Vegetarian dietary patterns and mortality in Adventist Health Study 2. JAMA Intern Med 2013;173:1230-1238.

 , Mahsa Samadi1