ABSTRACT
Differential bitterness perception associated with genetic polymorphism in the bitter taste receptor gene taste 2 receptor member 38 (TAS2R38) may influence an individual's food preferences, nutrition consumption, and eventually chronic nutrition-related disorders including cardiovascular disease. Therefore, the effect of genetic variations on nutritional intake and clinical markers needs to be elaborated for health and disease prevention. In this study, we conducted sex-stratified analysis to examine the association between genetic variant TAS2R38 rs10246939 A > G with daily nutritional intake, blood pressure, and lipid parameters in Korean adults (males = 1,311 and females = 2,191). We used the data from the Multi Rural Communities Cohort, Korean Genome and Epidemiology Study. Findings suggested that the genetic variant TAS2R38 rs10246939 was associated with dietary intake of micronutrients including calcium (adjusted p = 0.007), phosphorous (adjusted p = 0.016), potassium (adjusted p = 0.022), vitamin C (adjusted p = 0.009), and vitamin E (adjusted p = 0.005) in females. However, this genetic variant did not influence blood glucose, lipid profile parameters, and other blood pressure markers. These may suggest that this genetic variation is associated with nutritional intake, but its clinical effect was not found. More studies are needed to explore whether TAS2R38 genotype may be a potential predictive marker for the risk of metabolic diseases via modulation of dietary intake.
-
Keywords: Blood pressure; Genetic variation; Lipids; Nutrient intake; Taste
INTRODUCTION
Earlier studies reported that dietary intake, tobacco smoking, physical activity, and other lifestyle factors are significant risk modifying factors in the etiology of obesity, hypertension, and dyslipidemia, which are subsequently associated with cardiovascular disorders [
1,
2]. Although it is clear that an individual’s genetic traits are decisive factors in health issues, the interaction between gene and those factors could control the effect of genetic susceptibility to common chronic diseases [
3]. Therefore, it emphasizes the importance of epidemiological studies focusing on the associations of genetic characteristics and nutrition – the most common environmental factors related to disease that would help better understanding the health and disease etiology.
The individual’s sense of taste could play a crucial role in detecting the nature and quality of food and related health conditions [
4,
5]. One of the significant sensory elements is the ability to sense bitterness [
6,
7,
8]. Bitter taste sensitivity is a trait that could serve as a marker for differential food preferences [
9]. Individuals exhibit differential bitter taste sensitivity, influencing their food preferences and body composition. Research also confirms that many bitter compounds are medicinal in nature such as those found in cruciferous vegetables [
10]. Therefore, individuals who perceive bitter compounds differently may end up with different dietary habits that could lead to adverse metabolic and health effects [
11]. Thus, bitterness sensitivity and the genetics behind it are an exciting area of research, and the most extensively studied bitterness receptor gene taste 2 receptor member 38 (
TAS2R38, T2R38) mediates the mechanism of bitter taste perception [
6,
12].
The genetic variation of the bitter taste receptor gene
TAS2R38 has been associated with an individuals' differential sensitivity to bitter taste and food intake. Hence, these genetic variants could modify the risk for diet-related diseases and become a potential biomarker for disease conditions. It is known that the consumption of vegetables, fruits, cereals, mushrooms, wildflowers, and medicinal plants could serve as a protective factor against several chronic diseases [
13]. A healthy diet also benefits vascular condition by affecting risk markers such as blood pressure and blood lipid profiles. The genetic variants of
TAS2R38 leading to differential taste sensitivity could play as a decisive marker of disease, including obesity and metabolic disorder. A number of previous studies showed associations of the intake of vegetables with 6-n-propylthiouracil (PROP) bitterness and
TAS2R38 genotype [
14,
15,
16]. In a Korean study, food group-based consumption analyses suggested that fruit intake and body mass index (BMI) were significantly associated with
TAS2R38 rs10246939 [
17]. In addition, the
TAS2R38 genetic variation has also been linked to the perception of fat [
18]. A study in a group of Iraqi individuals also reported that in phenylthiocarbamide (PTC) non-taster male's higher intake of salts lead to higher blood pressure [
19]. Although limited association was evident,
TAS2R38 genetic variants were tested and their effects on the determinants of coronary heart disease were studied in a British cohort [
20]. These may indicate that through dietary behavior,
TAS2R38 genetic variants could become a potential reason for the variability in health status. Thus, the variants appear to contribute to dietary consumption, body weight, and related metabolic phenotypes even though there were ethnicity-based differences in relevant research. However, little is known about its association with daily nutritional intake, which should be explored to study the effect of this genotype on the intake of essential nutrients to explore further the metabolic pathways related to diet.
Therefore, to further explore the effect of TAS2R38 rs10246939 A > G as a prediction marker for the risk of disease through dietary consumption, this study aimed to analyze its associations with daily dietary nutritional intake in a Korean population. Furthermore, the association between the genetic variation and markers for blood pressure, glucose, and lipid profile were also examined.
MATERIALS AND METHODS
Study population
The present study was performed with dataset from Multi Rural Communities Cohort (MRCohort) study, which is a section of Korean Genome and Epidemiology Study (KoGES). KoGES was initiated by the Korean government funding: National Research Institute of Health, Centers for Disease Control and Prevention (KCDC) and the Ministry of Health and Welfare, Korea [
21]. All data regarding epidemiology, clinic, diet, and genetics were obtained from the organization (KCDC). The subjects were mainly recruited from rural areas of the country using multistage cluster technique in certain villages of selected areas including Namwon, Yangpyeong, Goryeong, Wonju, Pyeongchang, and Ganghwa from January 2005–February 2010. From the MRCohort dataset with the genetic information of
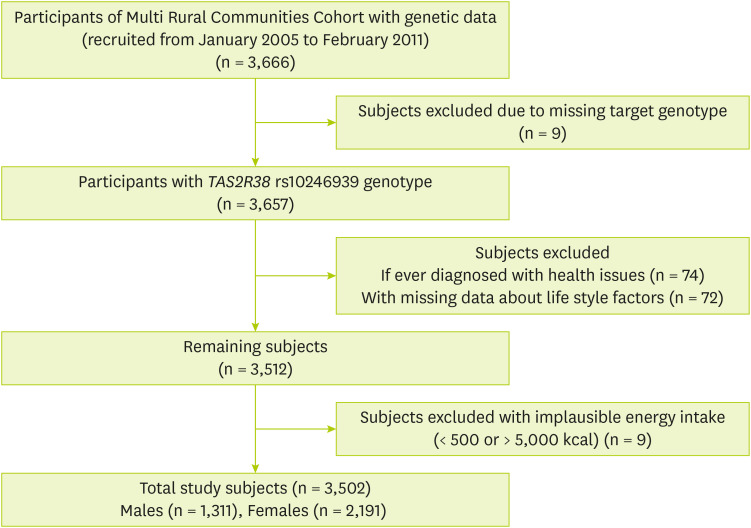
TAS2R38 rs10246939 genotype (n = 3,666), the subjects were excluded: if they were having missing genetic data for target locus (n = 9); and were already diagnosed with hypertension (n = 46), hyperlipidemia (n = 6), or diabetes mellitus (n = 22). Additionally, those individuals who lacked records from lifestyle characteristics smoking (n = 2), alcohol drinking (n = 3), marital status (n = 18), education (n = 5), exercise (n = 36), and height (n = 8), as well as individuals with an implausible total energy intake < 500 or > 5,000 kcal/day (n = 9) were also excluded. Finally, a total of 3,502 participants (1,311 males and 2,191 females) aged from 40 to 89 years were analyzed in the study (
Figure 1). The study protocol of MRCohort was approved by three Institutional Review Boards (IRBs; Hanyang University, Chonnam National University, and Keimyung University). Before the commencement of the study, all participants provided with written informed consent. Ethical approval for this study was also obtained after evaluation by the IRB (40525-201802-HR-121-07).
Figure 1Subject selection process in the present study.

Descriptive data of the study subjects
Data on descriptive and lifestyle characteristics, including age, sex, smoking, alcohol drinking, education and regular exercise, were collected by trained investigators using questionnaires. Both tobacco use and alcohol consumption status was defined as never, past, or current. The BMI was calculated by dividing the body weight (kg) by the squared height (m
2). The educational levels were defined as elementary graduate (≤ 6 years), high school graduate (7–12 years), and college-level education or higher (> 12 years). Regular exercise was also defined as “Yes,” when they exercised ≥ 3 times per week for about half an hour or more [
22].
The dietary data were collected using a validated food frequency questionnaire [
23]. The trained technicians interviewed the participants. To analyze the influence of
TAS2R38 rs10246939 variant on nutritional intake, nutritional data including daily intake of energy, fat, proteins, carbohydrates as well as micronutrients (minerals and vitamins) were estimated established by using the nutrient database of the Korean Nutrition Society, and the Korean Food Consumption Table (7th edition) [
24].
The standardized protocols were followed to measure biochemical markers [
25,
26]. The blood pressure markers including the systolic blood pressure (SBP), diastolic blood pressure (DBP), and pulse rate (times/minute) were measured with a standard mercury sphygmomanometer (Baumanometer; WA Baum Co., Inc., Copiague, NY, USA) using the first and fifth Korotkoff sounds, to the nearest 2 mmHg [
25]. The average value of the last two measurements was considered. For blood analysis, the blood samples were collected in the morning from the antecubital vein. The lipid profile parameters including total cholesterol, triglycerides, high-density lipoprotein, and fasting glucose were measured enzymatically using a 747 Chemistry Analyzer (Hitachi, Tokyo, Japan) [
25,
26].
Genotyping data was conducted and obtained from KCDC, as described above. Genomic DNA from fasting peripheral blood samples was used genotype determination. Illumina Omni 1 Quad bead microarray (Illumina Inc., San Diego, CA, USA) was used to genotype as instructed by manufacturer. To ensure the quality of the genotyping data, samples with low call rate (< 99%), had excessive heterozygosity, or sex inconsistency and cryptic first-degree relatives were excluded from subsequent analyses. Furthermore, as an additional step to ensure the quality of the genotyping data, single nucleotide polymorphisms (SNPs) that exhibited high missing genotype call rates (> 5%), low minor allele frequency (MAF) (< 0.01), and significant deviation from Hardy-Weinberg equilibrium (
P < 10
−6) were excluded from the analysis [
27,
28,
29]. Finally, among obtained approximately 730,000 SNPs,
TAS2R38 rs10246939 variant genotype was analyzed for this study.
The influence of bitterness genotype on dietary intake and associated factors could vary with sex [
17,
30,
31,
32,
33]. Therefore, sex-stratified analysis was conducted in the current study. The categorical variables were reported as frequencies and percentages, while continuous variables were reported as means ± standard deviation. Prior to analysis, the continuous variables such as age, BMI, nutrients, and biochemical variables were changed to the logarithmic form. Using residual method, the nutritional intake data was adjusted for total energy intake [
34]. The association of
TAS2R38 rs10246939 genotypes with general characteristics including age, BMI, education, alcohol drinking, smoking status, and regular exercise was analyzed using general linear model (GLM) and chi-squared tests. The GLM was also used to evaluate the effect of genotype on all continuous variables including nutrients intake and blood parameters, either presence (adjusted) or absence (crude) of covariates.
Post hoc tests were performed to verify the differences between pair of genotypes following Tukey’s honest significant difference rule. A p value < 0.05 was considered statistically significant. Statistical analyses were conducted using SAS version 9.3 (SAS institute Inc., Cary, NC, USA) and SPSS version 22 (SPSS Inc., IBM Corp., Armonk, NY, USA).
RESULTS
General characteristics and TAS2R38 genotype distribution
The general characteristics of the study population and genetic distribution of
TAS2R38 rs10246939 are presented in
Table 1. A total of 3,502 individuals (37.4% males and 62.5% females) were selected for study. The subject’s ages ranged from 40 to 89 years. In males, 36.3, 48.7, and 15.0% of subjects had the GG, AG, and AA genotypes, respectively, while in females, 33.4, 48.4, and 18.2% of the subjects possessed the GG, AG, and AA genotypes, respectively. The overall MAF was 0.412, which was similar to earlier reports [
12,
17]. The subjects’ general characteristics showed that tobacco use (p = 0.027) and BMI (p = 0.003) were associated with genotype in females only.
Table 1General characteristics of the subjects in association with the TAS2R38 rs10246939 genotype
Table 1
|
Variables |
Males |
Females |
|
GG (n = 476, 36.3%) |
AG (n = 638, 48.7%) |
AA (n = 197, 15.0%) |
p |
GG (n = 731, 33.4%) |
AG (n = 1,061, 48.4%) |
AA (n = 399, 18.2%) |
p |
|
Age (yr) |
60.85 (10.1) |
61.59 (10.0) |
61.42 (8.7) |
0.613 |
58.68 (9.7) |
59.23 (10.0) |
58.03 (10.0) |
0.110 |
|
BMI (kg/m2) |
23.41 (2.9) |
23.48 (2.9) |
23.56 (2.9) |
0.819 |
23.81 (2.9) |
23.89 (3.1) |
24.47 (3.2) |
0.003 |
|
Tobacco smoking |
|
|
|
0.057 |
|
|
|
0.027 |
|
Never |
122 (25.6) |
138 (21.6) |
34 (17.3) |
702 (96.0) |
1,003 (94.5) |
376 (94.2) |
|
Past |
178 (37.4) |
231 (36.2) |
87 (44.2) |
10 (1.4) |
23 (2.2) |
2 (0.5) |
|
Current |
176 (37.0) |
269 (42.2) |
76 (38.6) |
19 (2.6) |
35 (3.3) |
21 (5.3) |
|
Alcohol drinking |
|
|
|
0.854 |
|
|
|
0.323 |
|
Never |
128 (26.9) |
159 (24.9) |
46 (23.4) |
449 (61.4) |
701 (66.1) |
259 (64.9) |
|
Past |
49 (10.3) |
68 (10.7) |
19 (9.6) |
20 (2.7) |
21 (2.0) |
10 (2.5) |
|
Current |
299 (62.8) |
411 (64.4) |
132 (67.0) |
262 (35.8) |
339 (32.0) |
130 (32.6) |
|
Education level |
|
|
|
0.222 |
|
|
|
0.176 |
|
Elementary school or less |
241 (50.6) |
346 (54.2) |
100 (50.8) |
523 (71.5) |
723 (68.1) |
280 (70.2) |
|
Middle-high school |
188 (39.5) |
238 (37.3) |
70 (35.5) |
174 (23.8) |
300 (28.3) |
99 (24.8) |
|
College /more |
47 (9.9) |
54 (8.5) |
27 (13.7) |
34 (4.7) |
38 (3.6) |
20 (5.0) |
|
Regular exercise |
|
|
|
0.624 |
|
|
|
0.623 |
|
No |
346 (72.7) |
480 (75.2) |
147 (74.6) |
533 (72.9) |
789 (74.4) |
301 (75.4) |
|
Yes |
130 (27.3) |
158 (24.8) |
50 (25.4) |
198 (27.1) |
272 (25.6) |
98 (24.6) |
Dietary nutritional intake in association with TAS2R38 rs10246939
The daily nutritional intake levels for each
TAS2R38 rs10246939 genotype in males and females are shown in
Tables 2,
3, and
4. It was evident that the consumption of macronutrients was not associated with the genotype as shown in
Table 2. However, the effect of genotype on daily intake of micronutrients varied with sex. In males, the daily intake of vitamins and minerals was not significantly associated with the genetic variant (
Table 3). On the other hand, females show significant associations of
TAS2R38 rs10246939 with few minerals and vitamins intake (
Table 4). In females, the
TAS2R38 rs10246939 genotype was associated with the daily intake of calcium (adjusted p = 0.007), phosphorous (adjusted p = 0.016), potassium (adjusted p = 0.022), vitamin C (adjusted p = 0.009), and vitamin E (adjusted p = 0.005). Following
post hoc tests, the GG genotype had significant effects on intake of nutrients. The GG genotype had the higher level of daily nutritional intake of calcium, phosphorus, potassium, and vitamin E than females with the AG genotypes, and also had more vitamin C, compared to AG and AA genotypes.
Table 2Intake levels of energy and macronutrients in the subjects according to the TAS2R38 rs10246939 genotype
Table 2
|
Variables |
GG |
AG |
AA |
p crude
|
p adjusted
|
|
Males |
n = 476 |
n = 638 |
n = 197 |
|
|
|
Total energy (kcal/day) |
1,586.8 ± 474.2 |
1,571.4 ± 481.1 |
1,601.2 ± 521.3 |
0.758 |
0.702 |
|
Carbohydrates (g/day) |
301.2 ± 26.3 |
300.3 ± 25.6 |
302.8 ± 23.1 |
0.454 |
0.452 |
|
Proteins (g/day) |
48.4 ± 10.2 |
47.7 ± 9.9 |
47.6 ± 8.9 |
0.536 |
0.517 |
|
Fats (g/day) |
19.3 ± 8.8 |
19.7 ± 9.8 |
18.7 ± 8.3 |
0.708 |
0.668 |
|
Females |
n = 731 |
n = 1,061 |
n = 399 |
|
|
|
Total energy (kcal/day) |
1,608.6 ± 517.6 |
1,596.2 ± 476.0 |
1,656.7 ± 506.0 |
0.110 |
0.098 |
|
Carbohydrates (g/day) |
302.1 ± 27.1 |
302.7 ± 26.6 |
302.6 ± 26.7 |
0.906 |
0.879 |
|
Proteins (g/day) |
48.2 ± 9.8 |
47.4 ± 9.4 |
48.5 ± 10.1 |
0.090 |
0.138 |
|
Fats (g/day) |
19.6 ± 9.8 |
18.9 ± 9.3 |
19.4 ± 8.8 |
0.179 |
0.230 |
Table 3Intake levels of selected micronutrients in the male subjects according to the TAS2R38 rs10246939 genotype
Table 3
|
Variables |
GG (n = 476) |
AG (n = 638) |
AA (n = 197) |
p crude
|
p adjusted
|
|
Minerals |
|
|
|
|
|
|
Calcium (mg) |
371.2 ± 193.6 |
360.3 ± 177.9 |
363.6 ± 162.3 |
0.757 |
0.788 |
|
Phosphorus (mg) |
772.0 ± 168.1 |
759.9 ± 160.0 |
765.2 ± 150.0 |
0.491 |
0.489 |
|
Iron (mg) |
7.8 ± 3.1 |
7.6 ± 2.3 |
7.6 ± 2.0 |
0.801 |
0.823 |
|
Potassium (mg) |
1,902.0 ± 701.4 |
1,868.2 ± 648.2 |
1,916.3 ± 599.2 |
0.432 |
0.465 |
|
Sodium (mg) |
2,583.5 ± 1,474.5 |
2,476.7 ± 1,330.8 |
2,555.7 ± 1,173.6 |
0.489 |
0.517 |
|
Zinc (mg) |
6.4 ± 1.2 |
6.4 ± 1.4 |
6.4 ± 1.4 |
0.780 |
0.800 |
|
Vitamins |
|
|
|
|
|
|
Vitamin A (mg) |
380.1 ± 279.7 |
354.1 ± 252.0 |
348.1 ± 203.6 |
0.431 |
0.488 |
|
Vitamin B1 (mg) |
0.8 ± 0.1 |
0.8 ± 0.2 |
0.8 ± 0.1 |
0.785 |
0.799 |
|
Vitamin B2 (mg) |
0.7 ± 0.2 |
0.7 ± 0.2 |
0.6 ± 0.2 |
0.720 |
0.713 |
|
Niacin (mg) |
11.7 ± 2.7 |
11.5 ± 2.6 |
11.7 ± 2.6 |
0.450 |
0.458 |
|
Vitamin C (mg) |
89.2 ± 52.0 |
85.9 ± 48.0 |
88.2 ± 42.7 |
0.256 |
0.286 |
|
Vitamin B6 (mg) |
1.3 ± 0.3 |
1.3 ± 0.3 |
1.3 ± 0.2 |
0.567 |
0.593 |
|
Folic acid (ug) |
179.9 ± 86.3 |
176.6 ± 78.4 |
175.3 ± 60.8 |
0.778 |
0.816 |
|
Vitamin E (mg) |
6.4 ± 2.4 |
6.2 ± 2.2 |
6.2 ± 2.1 |
0.433 |
0.425 |
Table 4Intake levels of selected micronutrients in the female subjects according to the TAS2R38 rs10246939 genotype
Table 4
|
Variables |
GG (n = 731) |
AG (n = 1,061) |
AA (n = 399) |
p crude
|
p adjusted
|
|
Minerals |
|
|
|
|
|
|
Calcium (mg) |
364.4 ± 177.5a
|
340.1 ± 168.8b
|
359.0 ± 177.0ab
|
0.005 |
0.007 |
|
Phosphorus (mg) |
767.7 ± 157.6a
|
748.4 ± 151.0b
|
769.8 ± 164.6ab
|
0.011 |
0.016 |
|
Iron (mg) |
7.7 ± 2.4 |
7.4 ± 2.2 |
7.6 ± 2.4 |
0.150 |
0.184 |
|
Potassium (mg) |
1,906.7 ± 684.8a
|
1,817.9 ± 658.0b
|
1,856.2 ± 643.7ab
|
0.019 |
0.022 |
|
Sodium (mg) |
2,513.0 ± 1,354.9 |
2,396.8 ± 1,205.4 |
2,460.3 ± 1,238.4 |
0.336 |
0.370 |
|
Zinc (mg) |
6.4 ± 1.2 |
6.4 ± 1.7 |
6.6 ± 2.0 |
0.112 |
0.203 |
|
Vitamins |
|
|
|
|
|
|
Vitamin A (mg) |
358.1 ± 247.2 |
339.0 ± 232.3 |
349.3 ± 243.8 |
0.273 |
0.322 |
|
Vitamin B1 (mg) |
0.8 ± 0.2 |
0.8 ± 0.2 |
0.8 ± 0.1 |
0.444 |
0.412 |
|
Vitamin B2 (mg) |
0.7 ± 0.2 |
0.6 ± 0.2 |
0.6 ± 0.2 |
0.103 |
0.126 |
|
Niacin (mg) |
11.7 ± 2.5 |
11.5 ± 2.5 |
11.8 ± 2.6 |
0.071 |
0.100 |
|
Vitamin C (mg) |
89.8 ± 50.8a
|
84.4 ± 50.4b
|
81.5 ± 45.9b
|
0.009 |
0.009 |
|
Vitamin B6 (mg) |
1.3 ± 0.3 |
1.3 ± 0.3 |
1.3 ± 0.2 |
0.168 |
0.159 |
|
Folic acid (ug) |
179.2 ± 79.7 |
171.8 ± 76.3 |
169.4 ± 70.8 |
0.081 |
0.082 |
|
Vitamin E (mg) |
6.4 ± 2.4a
|
6.1 ± 2.3b
|
6.1 ± 2.1ab
|
0.005 |
0.005 |
Blood biochemical markers with TAS2R38 rs10246939
To ascertain the association between
TAS2R38 rs10246939 and bio-clinical markers including blood pressure markers, glucose levels, and lipid parameters, sex stratified analysis was performed. The results revealed that the multiple blood pressure markers, including (SBP, DBP, and pulse rate) (
Table 5), as well as the blood glucose levels and lipid parameters (total cholesterol, triglycerides, and high-density lipoproteins) (
Table 6) were not significantly associated with the genotype under study.
Table 5Blood pressure markers of the male and female subjects according to the TAS2R38 rs10246939 genotypes
Table 5
|
Variables |
GG |
AG |
AA |
p crude
|
p adjusted
|
|
Males |
n = 476 |
n = 638 |
n = 197 |
|
|
|
Pulse rate (times/min) |
68.5 ± 9.2 |
69.0 ± 9.7 |
66.9 ± 9.1 |
0.086 |
0.093 |
|
SBP (mmHg) |
117.5 ± 11.0 |
118.7 ± 10.6 |
118.7 ± 10.0 |
0.274 |
0.380 |
|
DBP (mmHg) |
76.8 ± 7.6 |
76.7 ± 7.3 |
77.0 ± 7.6 |
0.961 |
0.998 |
|
Females |
n = 731 |
n = 1,061 |
n = 399 |
|
|
|
Pulse rate (times/min) |
68.6 ± 9.1 |
68.8 ± 9.1 |
69.7 ± 8.8 |
0.176 |
0.150 |
|
SBP (mmHg) |
115.2 ± 11.9 |
114.1 ± 11.8 |
115.7 ± 10.9 |
0.089 |
0.113 |
|
DBP (mmHg) |
74.3 ± 7.4 |
74.3 ± 7.2 |
74.6 ± 7.5 |
0.882 |
0.984 |
Table 6Blood glucose and lipid parameters of the male and female subjects according to the TAS2R38 rs10246939 genotype
Table 6
|
Variables (mg/dL) |
GG |
AG |
AA |
p crude
|
p adjusted
|
|
Males |
n = 476 |
n = 638 |
n = 197 |
|
|
|
Total cholesterol |
185.8 ± 33.1 |
189.9 ± 34.7 |
189.0 ± 35.1 |
0.165 |
0.171 |
|
Triglycerides |
140.4 ± 91.5 |
146.8 ± 101.9 |
146.9 ± 96.7 |
0.456 |
0.540 |
|
High density lipoproteins |
43.3 ± 10.7 |
44.3 ± 11.5 |
45.1 ± 13.0 |
0.223 |
0.141 |
|
Blood glucose |
95.0 ± 9.5 |
95.8 ± 9.9 |
94.8 ± 9.6 |
0.283 |
0.286 |
|
Females |
n = 731 |
n = 1,061 |
n = 399 |
|
|
|
Total cholesterol |
200.7 ± 35.5 |
200.3 ± 36.2 |
201.6 ± 34.9 |
0.755 |
0.721 |
|
Triglycerides |
141.6 ± 76.3 |
143.4 ± 87.5 |
143.9 ± 82.4 |
0.779 |
0.739 |
|
High density lipoproteins |
46.4 ± 10.7 |
46.4 ± 10.5 |
45.5 ± 9.6 |
0.384 |
0.593 |
|
Blood glucose |
92.9 ± 8.8 |
93.1 ± 9.3 |
92.9 ± 9.9 |
0.806 |
0.621 |
DISCUSSION
The present study investigated the association of the genetic variant in the TAS2R38 bitterness receptor (rs10246939 A > G) with daily nutritional intake and biochemical parameters in the Korean population. The findings suggested that the Korean female’s dietary intake of few micronutrients is influenced by this genotype. However, there is no evidence for its association with bio-clinical markers in both genders.
From the analyses between the
TAS2R38 rs10246939 genetic variation and study population’s general characteristics, the results suggest that the lifestyle factors, including age, alcohol consumption, behavior, education, and regular exercise were not associated with the distribution of the variation. However, the distribution of the
TAS2R38 genotype was associated with BMI and smoking behavior, which is consistent with earlier studies [
17,
35]. There has been considerable interest in the association between the bitterness variations and markers of adiposity. The potential regulatory role of T2R38 in sensory and appetite mechanism, and furthermore with metabolism in energy balance and adiposity-related digestive system, may be linked to the association between the bitterness genetic variation and BMI [
8,
17,
18,
36,
37]. The genetic variation was also associated with females’ smoking behavior. Earlier studies showed that the
TAS2R38 genetic variation is associated with tobacco smoking. The differential bitterness perception could be a modifying role in the use of substance such as tobacco [
38]. However, in this study, the genetic effect was only evident in females’ smoking. Self-reported data could underestimate smoking status and should be considered while interpreting the results. In this study, only approximately 5%–6% of females were ever-smoker, which was similar to the WHO 2017 report [
39]. The underreporting issue in females for tobacco use has been widely spread due to multiple reasons, including social pressure [
40]. Therefore, this rarity may underlie in this gene-health behavior association.
Inconsistencies based on ethnic-specific differences in taste responses and perception that contribute to the development of different dietary preferences were reported. One Korean cancer case-control study reported that there were no clear relationship between the
TAS2R38 genetic variation and macronutrients and dietary consumption [
41]. The use of strongly flavored condiments in Korean cuisine may potentially mask the bitter taste of foods, hence, making it difficult to study the associations between
TAS2R38 and dietary nutrients consumption [
41,
42]. Other studies from various ethnicities including African-American, Hispanic, Latino, Caucasian, and Asian also supported the null effect of
TAS2R38 genetic variation on dietary intake [
31,
43,
44]. However, several studies still reported the association of polymorphism in
TAS2R38 causing alterations in bitterness perception leading to differential dietary intake. The association between PROP bitterness,
TAS2R38 genotype, and vegetable intake has been consistent in the number of earlier studies [
14,
15,
16]. The
TAS2R38 genetic variation has also been associated with the perception of fat [
18], dietary intake of total vegetables, cruciferous vegetables, sweets, tobacco, and alcohol, which may in turn could affect micronutrient intake [
8,
17,
36,
37]. The present study shows the evidence that the bitterness genotype is associated with differential nutrients intake. An earlier study did not support the influence of
TAS2R38 diplotypes on dietary intake of micronutrients (vitamin C), but it highlighted the possible nutrient-nutrient effect on bioavailability of nutrients [
45]. Vegetables and fruits contain major nutrients such as carbohydrates, proteins, lipids, vitamins, and minerals. They also possess some crucial phytonutrients which are mostly bitter in taste, including polyphenols, flavonoids, isoflavones, terpenes, and glucosinolates [
7]. The consumption of these nutrients could potentially lower the risk of chronic diseases such as cancer and cardiovascular disease [
46]. Fruits do not contain bitter compounds called glucosinolates, but they are a rich source of many essential nutrients such as potassium, vitamins E and C, folate, and dietary fiber. Furthermore, vitamin E is fat-soluble, essential micronutrient, and an exogenous antioxidant. The most prominent sources of vitamin E are edible vegetable oils, such as those of corn, olive, palm, rice bran, and peanut [
47]. Thus, the genotype could be associated with fat-soluble nutrients consumption [
48].
In addition to ethnicity-based variations, the sex was found to be correlated with the genetic effect on dietary behavior. Earlier, among Japanese females the PTC/PROP-nontaster
TAS2R38 genotype/haplotype was found to be correlated with height and weight leading to higher daily energy consumption [
32]. A previous Korean study utilizing the MRCohort reported that the genetic variant
TAS2R38 rs10246939 showed moderate association with Korean females’ total fruit intake [
17]. In line with this, present study also shows the evidence that the bitterness genotype is associated with differential nutrients intake in females. In current study, although the findings of our study showed little correlation with nutritional intake, but in line with previous Korean study, sex-genotype association was clear. This may be resulted from the differential health behavior of males and females. According to various reports, females tend to exhibit a greater level of concern regarding their dietary habits in comparison to males. Females possess a more thorough understanding of issues related to food, nutrition, and diet [
49,
50,
51], which leads to higher intake of fruits, vegetables, dietary fibre and lower intake of fats and salts [
52]. It is also a well-established fact that behaviours associated with unhealthy dietary habits, such as smoking and alcohol use, tend to be more prevalent among males than females. Therefore, this differential nature of sex-disparity about health may lead to varied health behaviors and outcome, interacting with the genetic factor including
TAS2R38. Moreover, this may also suggest that to study the potential role of the bitterness gene as a predictive marker of the underlying mechanisms that contribute to the development of obesity, it is crucial to take into account the influence of sex as a contributing factor. Further research should be conducted based on sex differences in individuals to have more comprehensive understanding of the role of the
TAS2R38 gene in health and disease etiology in both males and females.
Limited evidences only exist surrounding bitterness genetic variation and saltiness and sodium intake [
45,
46,
47,
48]. However, a study with young Japanese females suggested that the genetic variation in
TAS2R38 contributed to increased sodium intake [
48]. A study with small number of Iraqi males investigated the PTC phenotype and blood pressure marker. They reported that most non-tasters had high blood pressure and higher intake of salty foods [
19]. It has been well-known that consuming excessive sodium is a major risk factor for hypertension [
53,
54]. In line with this, the current study examined the effect of the bitterness genotype on dietary sodium intake and blood pressure markers (SBP, DBP, and pulse rate), yet we did not find clear evidence. In Korea, Kimchi is one of the most consumed side dishes. A recent report revealed that it is one of the most significant contributors to salt intake among Koreans and is mainly prepared from cabbage (cruciferous vegetables) [
55]. Therefore, it may be possible that the
TAS2R38 genetic variation may be associated with salt intake and further blood pressure markers by the differential cruciferous vegetable’s consumption. However, this was not evident in the current study. One interesting Korean study suggested that the cluster of differentiation 36 fat sensory related gene was associated with cruciferous vegetable intake, but not
TAS2R38 bitterness receptor [
56]. The use of various condiments and higher overall sodium consumption level is common in this Korean population [
57,
58]. Thus, it is possible that the SNP is not associated with significant sources of dietary sodium, sodium intake itself, and blood pressure biomarkers. Additionally, the hypertensive individuals were excluded from the data set under study. Thus, the effect of
TAS2R38 genetic variation may not be clearly observed in the subjects.
To date, only a few studies have investigated the relationship between
TAS2R38 genetic variations and metabolic phenotypes. The findings in the Sorbs cohort provided evidence for the association of biochemical variables and the
TAS2R38 genotype: 30-minute plasma glucose and the area under the curve for plasma glucose and
TAS2R38 genotype in men [
37]. The increased plasma leptin levels in Amish females also showed significant associations with the “PROP insensitive” allele of rs1726866
TAS2R38 [
33]. The altered glucose and insulin homeostasis were associated with
TAS2R haplotype, which links alimentary chemosensation and metabolic disease [
59]. According to a previous report, the risk of dyslipidemia in Korean men was 45.6% and 31.3% for women. Moreover, there is a drastic rise in the prevalence of dyslipidemia in the elderly population [
60,
61]. However, the effect of the
TAS2R38 genetic variation has not yet been explored in the Korean population and our study did not report such evidence for the measured level of plasma glucose. The lipid profile parameters, particularly total cholesterol, triglycerides, and high-density lipoproteins were also examined in present study. However, the results did not confirm a decisive association with
TAS2R38 rs10246939 genotype. A large population-based sample of British women provided evidence that the
TAS2R38 status was not an important determinant of bio-clinical markers analyzed [
20]. Similarly, the findings of an earlier study about the polymorphism rs713598 of the
TAS2R38 gene reported no association with a wide range of biochemical parameters in Italian adults [
18]. An American breast cancer–control study also reported no evidence for a significant association between PROP responsiveness and plasma lipids in females [
62]. As described previously, the genetic variation in bitterness receptor gene
TAS2R38 could modify the dietary behavior, intake, and, hence, nutritional intake and lipid parameters. However, such genotypic effect on taste perception, food preference, and consumption could be modified by multiple other biological and milieu factors [
63,
64]. This requires further studies for better understanding of the role of taste genetics in human health and disease.
The current study has several limitations. First, the study population (n = 3,502) did not represent the entire Korean population. Although data was from the MRCohort, one of the largest epidemiological study cohorts in Korea, participants are mainly from rural areas. Additionally, only a single locus
TAS2R38 rs10246939 was studied, although three SNP are known to show strong association [
17]. Daily nutrient intake was collected using food frequency questionnaire assessment method, which involves the use of closed-ended questionnaires that could affect the precision of dietary data [
65]. It is also important to note that there was no information on medications used, which may have potentially affected taste perception and bio-clinical markers.
In conclusion, this study suggests that the TAS2R38 rs10246939 genetic variation could influence the dietary nutritional intake in a Korean female population. Although the study provided no evidence that TAS2R38 polymorphism had a measurable influence on biochemical markers, the findings emphasize the possible associations of a genetic variant of bitter taste receptor gene through eating behavior that could become a potential reason for the variability in dietary intake and human health and disease.
Centers for Disease Control and Preventionhttps://doi.org/10.13039/100000030
KBN 2018-18
National Research Foundation of Koreahttps://doi.org/10.13039/501100003725
NRF-2018R1A1A1A050191552021R1A2C1008635
NOTES
-
Funding: This study was conducted with bioresources from the National Biobank of Korea, the Centers for Disease Control and Prevention, Republic of Korea (KBN 2018-18). This work was supported by the National Research Foundation of Korea (NRF) grant funded by the Korean Government (MSIT) (Nos. NRF-2018R1A1A1A05019155, 2021R1A2C1008635).
-
Conflict of Interest: The authors declare that they have no competing interests.
-
Author Contributions:
Conceptualization: Choi JH.
Data curation: Choi JH, Benish.
Formal analysis: Benish.
Funding acquisition: Choi JH.
Supervision: Choi JH.
Visualization: Benish.
Writing - original draft: Benish.
Writing - review & editing: Choi JH, Benish.
REFERENCES
- 1. Bustami J, Sukiasyan A, Kupcinskas J, Skieceviciene J, Iakoubov L, Szwed M, Kleinle C, Schumann RR, Puzianowska-Kuznicka M, Hamann L. Cholesteryl ester transfer protein (CETP) I405V polymorphism and cardiovascular disease in eastern European Caucasians - a cross-sectional study. BMC Geriatr 2016;16:144.
- 2. Ordovas JM. Gene-diet interaction and plasma lipid responses to dietary intervention. Biochem Soc Trans 2002;30:68-73.
- 3. Hunter DJ. Gene-environment interactions in human diseases. Nat Rev Genet 2005;6:287-298.
- 4. Tepper BJ. Nutritional implications of genetic taste variation: the role of PROP sensitivity and other taste phenotypes. Annu Rev Nutr 2008;28:367-388.
- 5. Tepper BJ, Banni S, Melis M, Crnjar R, Tomassini Barbarossa I. Genetic sensitivity to the bitter taste of 6-n-propylthiouracil (PROP) and its association with physiological mechanisms controlling body mass index (BMI). Nutrients 2014;6:3363-3381.
- 6. Drewnowski A, Henderson SA, Shore AB, Barratt-Fornell A. Sensory responses to 6-n-propylthiouracil (PROP) or sucrose solutions and food preferences in young women. Ann N Y Acad Sci 1998;855:797-801.
- 7. Drewnowski A, Gomez-Carneros C. Bitter taste, phytonutrients, and the consumer: a review. Am J Clin Nutr 2000;72:1424-1435.
- 8. Sandell M, Hoppu U, Mikkilä V, Mononen N, Kähönen M, Männistö S, Rönnemaa T, Viikari J, Lehtimäki T, Raitakari OT. Genetic variation in the hTAS2R38 taste receptor and food consumption among Finnish adults. Genes Nutr 2014;9:433.
- 9. Tepper BJ, Koelliker Y, Zhao L, Ullrich NV, Lanzara C, d’Adamo P, Ferrara A, Ulivi S, Esposito L, Gasparini P. Variation in the bitter-taste receptor gene TAS2R38, and adiposity in a genetically isolated population in Southern Italy. Obesity (Silver Spring) 2008;16:2289-2295.
- 10. Duffy VB, Hayes JE, Davidson AC, Kidd JR, Kidd KK, Bartoshuk LM. Vegetable intake in college-aged adults is explained by oral sensory phenotypes and TAS2R38 genotype. Chemosens Percept 2010;3:137-148.
- 11. Garcia-Bailo B, Toguri C, Eny KM, El-Sohemy A. Genetic variation in taste and its influence on food selection. OMICS 2009;13:69-80.
- 12. Risso DS, Mezzavilla M, Pagani L, Robino A, Morini G, Tofanelli S, Carrai M, Campa D, Barale R, Caradonna F, Gasparini P, Luiselli D, Wooding S, Drayna D. Global diversity in the TAS2R38 bitter taste receptor: revisiting a classic evolutionary PROPosal. Sci Rep 2016;6:25506.
- 13. Eastwood MA. Interaction of dietary antioxidants in vivo: how fruit and vegetables prevent disease? QJM 1999;92:527-530.
- 14. Drewnowski A, Henderson SA, Hann CS, Berg WA, Ruffin MT. Genetic taste markers and preferences for vegetables and fruit of female breast care patients. J Am Diet Assoc 2000;100:191-197.
- 15. Kaminski LC, Henderson SA, Drewnowski A. Young women’s food preferences and taste responsiveness to 6-n-propylthiouracil (PROP). Physiol Behav 2000;68:691-697.
- 16. Keller KL, Steinmann L, Nurse RJ, Tepper BJ. Genetic taste sensitivity to 6-n-propylthiouracil influences food preference and reported intake in preschool children. Appetite 2002;38:3-12.
- 17. Choi JH. Variation in the TAS2R38 bitterness receptor gene was associated with food consumption and obesity risk in Koreans. Nutrients 2019;11:1973.
- 18. Perna S, Riva A, Nicosanti G, Carrai M, Barale R, Vigo B, Allegrini P, Rondanelli M. Association of the bitter taste receptor gene TAS2R38 (polymorphism RS713598) with sensory responsiveness, food preferences, biochemical parameters and body-composition markers. A cross-sectional study in Italy. Int J Food Sci Nutr 2018;69:245-252.
- 19. Mohaus HA, Ayied AY. A study of the relationship between the taste sensitivity of phenylthiocarbamide (PTC) and blood pressure (random sample from the students of Qurna College/Basrah-Iraq). J Biosci Med 2018;6:1-12.
- 20. Timpson NJ, Christensen M, Lawlor DA, Gaunt TR, Day IN, Ebrahim S, Davey Smith G.
TAS2R38 (phenylthiocarbamide) haplotypes, coronary heart disease traits, and eating behavior in the British Women’s Heart and Health Study. Am J Clin Nutr 2005;81:1005-1011.
- 21. Kim Y, Han BG, Moon HK, Song JH. KoGES group. Yun Y min. Cohort profile: the Korean genome and epidemiology study (KoGES) consortium. Int J Epidemiol 2017;46:e20.
- 22. Kim MK, Shin J, Kweon SS, Shin DH, Lee YH, Chun BY, Choi BY. Harmful and beneficial relationships between alcohol consumption and subclinical atherosclerosis. Nutr Metab Cardiovasc Dis 2014;24:767-776.
- 23. Ahn Y, Kwon E, Shim JE, Park MK, Joo Y, Kimm K, Park C, Kim DH. Validation and reproducibility of food frequency questionnaire for Korean genome epidemiologic study. Eur J Clin Nutr 2007;61:1435-1441.
- 24. Food composition table. The Korean Nutrition Society. Recommended Dietary Allowances for Koreans. 7th ed. Seoul: The Korean Nutrition Society; 2000.
- 25. Cho NH, Kim KM, Choi SH, Park KS, Jang HC, Kim SS, Sattar N, Lim S. High blood pressure and its association with incident diabetes over 10 years in the Korean Genome and Epidemiology Study (KoGES). Diabetes Care 2015;38:1333-1338.
- 26. Friedewald WT, Levy RI, Fredrickson DS. Estimation of the concentration of low-density lipoprotein cholesterol in plasma, without use of the preparative ultracentrifuge. Clin Chem 1972;18:499-502.
- 27. Choi S, Jung S, Kim MK, Shin J, Shin MH, Shin DH, Lee YH, Chun BY, Hong KW, Hwang JY. Gene and dietary calcium interaction effects on brachial-ankle pulse wave velocity. Clin Nutr 2016;35:1127-1134.
- 28. Moon S, Kim YJ, Han S, Hwang MY, Shin DM, Park MY, Lu Y, Yoon K, Jang HM, Kim YK, Park TJ, Song DS, Park JK, Lee JE, Kim BJ. The Korea biobank array: design and identification of coding variants associated with blood biochemical traits. Sci Rep 2019;9:1382.
- 29. Kim YK, Moon S, Hwang MY, Kim DJ, Oh JH, Kim YJ, Han BG, Lee JY, Kim BJ. Gene-based copy number variation study reveals a microdeletion at 12q24 that influences height in the Korean population. Genomics 2013;101:134-138.
- 30. Beckett EL, Duesing K, Boyd L, Yates Z, Veysey M, Lucock M. A potential sex dimorphism in the relationship between bitter taste and alcohol consumption. Food Funct 2017;8:1116-1123.
- 31. Feeney EL, O’Brien SA, Scannell AG, Markey A, Gibney ER. Suprathreshold measures of taste perception in children - association with dietary quality and body weight. Appetite 2017;113:116-123.
- 32. Inoue H, Yamakawa-Kobayashi K, Suzuki Y, Nakano T, Hayashi H, Kuwano T. A case study on the association of variation of bitter-taste receptor gene TAS2R38 with the height, weight and energy intake in Japanese female college students. J Nutr Sci Vitaminol (Tokyo) 2013;59:16-21.
- 33. Dotson CD, Shaw HL, Mitchell BD, Munger SD, Steinle NI. Variation in the gene TAS2R38 is associated with the eating behavior disinhibition in Old Order Amish women. Appetite 2010;54:93-99.
- 34. Willett WC, Howe GR, Kushi LH. Adjustment for total energy intake in epidemiologic studies. Am J Clin Nutr 1997;65(Suppl):1220S-8S.
- 35. Choi JH, Lee J, Oh JH, Chang HJ, Sohn DK, Shin A, Kim J. Variations in the bitterness perception-related genes TAS2R38 and CA6 modify the risk for colorectal cancer in Koreans. Oncotarget 2017;8:21253-21265.
- 36. Lipchock SV, Mennella JA, Spielman AI, Reed DR. Human bitter perception correlates with bitter receptor messenger RNA expression in taste cells. Am J Clin Nutr 2013;98:1136-1143.
- 37. Keller M, Liu X, Wohland T, Rohde K, Gast MT, Stumvoll M, Kovacs P, Tönjes A, Böttcher Y.
TAS2R38 and its influence on smoking behavior and glucose homeostasis in the German Sorbs. PLoS One 2013;8:e80512.
- 38. Baker AN, Miranda AM, Garneau NL, Hayes JE. Self-reported smoking status, TAS2R38 variants, and propylthiouracil phenotype: an exploratory crowdsourced cohort study. Chem Senses 2018;43:617-625.
- 39. World Health Organization. WHO report on the global tobacco epidemic, 2017: monitoring tobacco use and prevention policies [Internet]. 2021. cited 2021 October 12. Available from https://apps.who.int/iris/bitstream/handle/10665/255874/97892415?sequence=1
- 40. Ayers JW, Hofstetter CR, Hughes SC, Park HR, Paik HY, Song YJ, Irvin V, Hovell MF. Gender modifies the relationship between social networks and smoking among adults in Seoul, South Korea. Int J Public Health 2010;55:609-617.
- 41. Choi JH, Lee J, Choi IJ, Kim YW, Ryu KW, Kim J. Genetic variation in the TAS2R38 bitter taste receptor and gastric cancer risk in Koreans. Sci Rep 2016;6:26904.
- 42. Schembre SM, Cheng I, Wilkens LR, Albright CL, Marchand L. Variations in bitter-taste receptor genes, dietary intake, and colorectal adenoma risk. Nutr Cancer 2013;65:982-990.
- 43. Keller KL, Olsen A, Cravener TL, Bloom R, Chung WK, Deng L, Lanzano P, Meyermann K. Bitter taste phenotype and body weight predict children’s selection of sweet and savory foods at a palatable test-meal. Appetite 2014;77:113-121.
- 44. Deshaware S, Singhal R. Genetic variation in bitter taste receptor gene TAS2R38, PROP taster status and their association with body mass index and food preferences in Indian population. Gene 2017;627:363-368.
- 45. Lucock M, Ng X, Boyd L, Skinner V, Wai R, Tang S, Naylor C, Yates Z, Choi JH, Roach P, Veysey M.
TAS2R38 bitter taste genetics, dietary vitamin C, and both natural and synthetic dietary folic acid predict folate status, a key micronutrient in the pathoaetiology of adenomatous polyps. Food Funct 2011;2:457-465.
- 46. Gupta C, Prakash D. Phytonutrients as therapeutic agents. J Complement Integr Med 2014;11:151-169.
- 47. Shahidi F, Pinaffi-Langley AC, Fuentes J, Speisky H, de Camargo AC. Vitamin E as an essential micronutrient for human health: common, novel, and unexplored dietary sources. Free Radic Biol Med 2021;176:312-321.
- 48. Inoue H, Kuwano T, Yamakawa-Kobayashi K, Waguri T, Nakano T, Suzuki Y. Perceived 6-n-propylthiouracil (PROP) bitterness is associated with dietary sodium intake in female Japanese college students. J Nutr Sci Vitaminol (Tokyo) 2017;63:167-173.
- 49. Pingitore R, Spring B, Garfield D. Gender differences in body satisfaction. Obes Res 1997;5:402-409.
- 50. Neumark-Sztainer D, Sherwood NE, French SA, Jeffery RW. Weight control behaviors among adult men and women: cause for concern? Obes Res 1999;7:179-188.
- 51. Davy SR, Benes BA, Driskell JA. Sex differences in dieting trends, eating habits, and nutrition beliefs of a group of midwestern college students. J Am Diet Assoc 2006;106:1673-1677.
- 52. Arganini C, Saba A, Comitato R, Virgili F, Turrini A. Gender differences in food choice and dietary intake in modern western societies. In: Maddock J, editor. Public Health - Social Behavioral Health. London: IntechOpen, 2012. p. 83-102.
- 53. Forouzanfar MH, Liu P, Roth GA, Ng M, Biryukov S, Marczak L, Alexander L, Estep K, Hassen Abate K, Akinyemiju TF, Ali R, Alvis-Guzman N, Azzopardi P, Banerjee A, Bärnighausen T, Basu A, Bekele T, Bennett DA, Biadgilign S, Catalá-López F, Feigin VL, Fernandes JC, Fischer F, Gebru AA, Gona P, Gupta R, Hankey GJ, Jonas JB, Judd SE, Khang YH, Khosravi A, Kim YJ, Kimokoti RW, Kokubo Y, Kolte D, Lopez A, Lotufo PA, Malekzadeh R, Melaku YA, Mensah GA, Misganaw A, Mokdad AH, Moran AE, Nawaz H, Neal B, Ngalesoni FN, Ohkubo T, Pourmalek F, Rafay A, Rai RK, Rojas-Rueda D, Sampson UK, Santos IS, Sawhney M, Schutte AE, Sepanlou SG, Shifa GT, Shiue I, Tedla BA, Thrift AG, Tonelli M, Truelsen T, Tsilimparis N, Ukwaja KN, Uthman OA, Vasankari T, Venketasubramanian N, Vlassov VV, Vos T, Westerman R, Yan LL, Yano Y, Yonemoto N, Zaki ME, Murray CJ. Global burden of hypertension and systolic blood pressure of at least 110 to 115mmHg, 1990–2015. JAMA 2017;317:165-182.
- 54. Mattes RD. The taste for salt in humans. Am J Clin Nutr 1997;65(Suppl):692S-7S.
- 55. Park HK, Lee Y, Kang BW, Kwon KI, Kim JW, Kwon OS, Cobb LK, Campbell NRC, Blakeman DE, Kim CI. Progress on sodium reduction in South Korea. BMJ Glob Health 2020;5:e002028.
- 56. Choi JH. Genetic variation in CD36 is associated with dietary intake in Korean males. Br J Nutr 2021;125:1321-1330.
- 57. Hwang J, Kim J, Moon H, Yang J, Kim MK. Determination of sodium contents in traditional fermented foods in Korea. J Food Compos Anal 2017;56:110-114.
- 58. Park J, Kwock CK. Sodium intake and prevalence of hypertension, coronary heart disease, and stroke in Korean adults. J Ethn Foods 2015;2:92-96.
- 59. Dotson CD, Zhang L, Xu H, Shin YK, Vigues S, Ott SH, Elson AE, Choi HJ, Shaw H, Egan JM, Mitchell BD, Li X, Steinle NI, Munger SD. Bitter taste receptors influence glucose homeostasis. PLoS One 2008;3:e3974.
- 60. Ha KH, Kwon HS, Kim DJ. Epidemiologic characteristics of dyslipidemia in Korea. J Lipid Atheroscler 2015;4:93-99.
- 61. Cho SM, Lee H, Lee HH, Baek J, Heo JE, Joo HJ, Hong SJ, Kim HC. Korean Society of Lipid and Atherosclerosis (KSoLA) Public Relations Committee. Dyslipidemia fact sheets in Korea 2020: an analysis of nationwide population-based data. J Lipid Atheroscler 2021;10:202-209.
- 62. Drewnowski A, Henderson SA, Cockroft JE. Genetic sensitivity to 6-n-propylthiouracil has no influence on dietary patterns, body mass indexes, or plasma lipid profiles of women. J Am Diet Assoc 2007;107:1340-1348.
- 63. Chen PJ, Antonelli M. Conceptual models of food choice: influential factors related to foods, individual differences, and society. Foods 2020;9:1898.
- 64. Diószegi J, Llanaj E, Ádány R. Genetic background of taste perception, taste preferences, and its nutritional implications: a systematic review. Front Genet 2019;10:1272.
- 65. Shim JS, Oh K, Kim HC. Dietary assessment methods in epidemiologic studies. Epidemiol Health 2014;36:e2014009.