ABSTRACT
Creating a complex balance between dietary composition, circadian rhythm, and the hemostasis control of energy is important for managing diseases. Therefore, we aimed to determine the interaction between cryptochrome circadian clocks 1 polymorphism and energy-adjusted dietary inflammatory index (E-DII) on high-sensitivity C-reactive protein in women with central obesity. This cross-sectional study recruited 220 Iranian women aged 18–45 with central obesity. The 147-item semi-quantitative food frequency questionnaire was used to assess the dietary intakes, and the E-DII score was calculated. Anthropometric and biochemical measurements were determined. By polymerase chain response-restricted length polymorphism method, cryptochrome circadian clocks 1 polymorphism was assigned. Participants were categorized into three groups based on the E-DII score, then categorized according to cryptochrome circadian clocks 1 genotypes. The mean and standard deviation of age, BMI, and high-sensitivity C-reactive protein (hs-CRP) were 35.61 ± 9.57 years, 30.97 ± 4.16 kg/m2, and 4.82 ± 5.16 mg/dL, respectively. The interaction of the CG genotype and E-DII score had a significant association with higher hs-CRP level compared to GG genotype as the reference group (β, 1.19; 95% CI, 0.11–2.27; p value, 0.03). There was a marginally significant association between the interaction of the CC genotype and the E-DII score with higher hs-CRP level compared to the GG genotype as the reference group (β, 0.85; 95% CI, −0.15 to 1.86; p value, 0.05). There is probably positive interaction between CG, CC genotypes of cryptochrome circadian clocks 1, and E-DII score on the high-sensitivity C-reactive protein level in women with central obesity.
-
Keywords: Gene; Nutrigenetics; DII; Central obesity; Hs-CRP
INTRODUCTION
Central obesity refers to the accumulation of excess fat around the abdomen, caused by an imbalance between energy intake and energy expenditure [
1]. According to a systematic review in 2020, the prevalence of central obesity is 41.5% in the world [
2]. In Iran, central obesity was estimated to be 42.8% and 12.9% among women and men, respectively; which shows, Iranian women are more at risk [
3]. The interaction between the world's food system, environment, and genetic factors has led to a high prevalence of obesity [
4]. Obesity increases the risk of non-communicable diseases and creates health burdens around the world [
4,
5]. But the ratio of waist to height (WHtR) is a better predictor for chronic disease and inflammation than general obesity [
6,
7]. Because visceral adipose tissue mass-produces pro-inflammatory biomarkers more than peripheral ones [
8]. Through all environmental factors, the diet has a strong effect on inflammation [
9] and regulates inflammatory responses [
10]. The dietary inflammatory index (DII) -a new tool for assessing the inflammatory potential of a diet- has an association with inflammatory cytokines, obesity, and greater waist circumference (WC) in different populations [
11].
Genes related to a circadian rhythm may affect obesity [
12] and inflammation [
13]. The circadian rhythm performed by exposure to light may have an association with central obesity. It can work according to the activation of transcription, clock genes suppression, and destruction of clock protein [
12]. Cryptochrome circadian clocks 1/2 (CRY1/2) are two main clock proteins that regulate circadian rhythms and affect energy metabolism [
14]. The clock gene proteins activate the expression of nuclear receptors like retinoic acid receptor-related orphan receptors, as target molecules in the treatment of metabolic disorders and vital intermediate nodes between the clock gene and abdominal obesity [
15].
Animal studies have shown that the lack of CRY, activates the expression of pro-inflammatory cytokines and augments susceptibility to obesity [
16].
In vivo and
in vitro studies have shown creating a complex balance between dietary composition, circadian rhythm, and the hemostasis control of energy [
17] is important for managing diseases [
12]. No study has assessed the interaction between CRY1 polymorphism and energy-adjusted dietary inflammatory index (E-DII) on high-sensitivity C-reactive protein (hs-CRP) in women with central obesity. Therefore, this study has hypothesized that the interaction of a diet with more pro-inflammatory potential and CRY1 polymorphism may be associated with a higher level of hs-CRP in women with central obesity.
MATERIALS AND METHODS
Participants
This cross-sectional study recruited 220 adult women with central obesity, aged 18 to 45 years old selected by a multi-stage cluster random sampling method that had been referred to health centers in Tehran, in 2017. All measurements related to anthropometry and blood samples were done in the school of Nutritional Sciences and Dietetics at Tehran University of Medical Sciences (TUMS). The Ethics Commission of Tehran University of Medical Sciences approved this study)IR.TUMS.VCR.REC.1398.051.(Participants were informed about the study protocol before the study began, and they were asked to complete informed consent. The eligibility criteria were BMI 25–40 kg/m
2 (being obese or overweight with WHtR > 0.50) with good general health. The exclusion criteria for this study were: having a history of cardiovascular disease, cancer, diabetes mellitus, liver, and kidney disease, having chronic illnesses affecting their diet, and also those with any significant body weight changes in the last 1 year. Also, subjects with daily energy intake < 800 kcal/d or > 4,200 kcal/d [
18], addicted to alcohol or drugs, smoking, pregnancy, currently lactating, menopause, and regular use of medications such as oral contraceptive pills.
The trained dietitian measured the weight, height, and WC of the participants. An electronic scale (Seca725 GmbH& Co., Hamburg, Germany) with an accuracy of 100 g was used to measure the weight of participants, while dressed in light clothing and without shoes. The height was measured with 0.5 cm precision while the participant's shoulders were in a relaxed position and were barefoot. The WC was determined with a tape at the narrowest point between the lower ribs and the iliac crest on light clothing without applying pressure to the body with a precision of about 0.5 cm. The BMI was calculated by dividing the weight (kg) by the height (meters squared). WHtR was determined by dividing the WC by height (cm). Waist hip ratio (WHR) was determined by dividing the WC by the hip circumference (cm).
Definition of central obesity
There are some kinds of cut points, WHtR ≥ 0.5 [
19,
20], WHR ≥ 0.8, and WC ≥ 88 cm [
21], which are considered central obesity for women [
22]. This study used WHtR ≥ 0.5 as the cut-off point. Because according to some studies WHtR is a better index for assessing central obesity [
7,
19,
20].
To assess participant's food intake, the 147-item semi-quantitative food frequency questionnaire (FFQ) was used, which had previously proven its validity and reliability [
23]. This questionnaire includes 147 food items consumed by Iranians, which has a standard size serving for each item based on 4 predefined groups, including daily weekly, and monthly frequent consumption. Trained assistants complete the questionnaires in face-to-face interviews at health centers in Tehran. Then amounts of food intake were converted to grams per day, by using household measurements [
24]. Nutritionist IV software, (version 7.0; N-Squared Computing, Salem, OR, USA) modified for Iranian cuisine, was used to analyze the nutrients [
25].
According to Shivappa et al. [
26], DII scores consist of 45 food items based on whether the concentration of 6 inflammatory biomarkers (CRP, interleukin [IL]-1 beta, IL-10, IL-4, IL-6, and tumor necrosis factor-alpha [TNF-α]) increases/decreases or is ineffective, giving +1, -1, and zero, respectively. Since not all food items are the same in all types of FFQ, the DII score was calculated according to the foods data that were available in our FFQ with some changes in the method of Shivappa et al. [
26], the same as many previous studies [
27]. Next, to compute the E-DII of subjects, the dietary data were connected to the regionally representative world database, which provided a strong estimate of the mean and standard deviation (SD) for each factor. These were used as multipliers to declare an individual’s contact relative to the ‘standard global mean’ as a z-score. For each food intake, a z-score was obtained by deducting the ‘standard mean’ from the real food parameter assessment and dividing it by its SD. Then, to minimalize the influence of ‘right skewing,’ this value was changed to a balanced percentile score, then minted by the respective food factor inflammatory influence score to attain the participant’s food parameter-specific E-DII score. All of the food-parameter-specific E-DII scores were collected to produce a total E-DII score per participant [
26]. The calculated E-DII score with 31 corresponding nutrients and food items listed in our frequency questionnaire including energy, carbohydrate, protein, fat, dietary fiber, n-6 fatty acids, n-3 fatty acids, mono-unsaturated fatty acids, polyunsaturated fatty acids, trans-fatty acids, saturated fatty acids, cholesterol, thiamin, riboflavin, niacin, Vitamin B-6, folate, vitamin B-12, vitamin A, ß-carotene, Vitamin D, vitamin C, vitamin E, zinc, magnesium, selenium, iron, and onion, garlic, caffeine, and tea [
25]. A higher E-DII indicates a more pro-inflammatory diet.
Blood samples of participants were collected early morning after 12 hours of fasting at night at the Nutrition and the Biochemistry Laboratory of the TUMS School of Nutritional Sciences Dietetics. Blood samples were collected in parental pipes having 0.1 EDTA, based on the standard protocol in a sitting situation. Serum samples were centrifuged for serum collection for 10 minutes at 300 rpm, diluted in 1 ml pipes, and kept at −80°C until the examination. We evaluated the serum concentrations of hs-CRP, as a sensitive marker of inflammation, by using an immunoturbidimetric assay (Randox laboratories kit, Hitachi LTD, Tokyo, Japan). By enzymatic methods using related kits (Pars Azemun, Iran) and an autoanalyzer system, serum concentrations of total cholesterol, high-density lipoprotein cholesterol, low-density lipoprotein cholesterol, and triglyceride were evaluated. Using the enzymatic colorimetric method using glucose oxidase, fasting blood sugar was measured.
Assessment of other variables
The information in the demographic questionnaire which included questions about age, marital status, educational level, economic status, and family history of migraine was collected by a trained dietitian. Using the International Physical Activity Questionnaire (IPAQ), the physical activity (PA) levels of participants were measured. Based on the list of daily usual activities in the past year, the frequency, and time spent on it, the levels of PA were divided into four categories including light, moderate, high, and very high-intensity activities. PA levels were stated as metabolic equivalent hours per week (METs/week).
DNA extraction
Subjects via available deoxyribonucleic acid (DNA) samples from whole blood were assessed for the rs2287161. By using Mini Columns (Type G Exgene; GeneAll Biotechnology, Seoul, Korea) according to the manufacturer’s protocol, the extraction of Genomic DNA was done. Based on the NanoDrop ND-2000 spectrometer, the quality and concentration of the extracted DNA extracted were determined. By using the polymerase chain response-restricted length polymorphism (PCR–RFLP) method, the rs2287161 was genotyped, with allele C as major and allele G as minor one. PCR detected the following primers: forward 5′-GGAACAGTGATTGGCTCTATCT-3′; reverse 5′-GGTCCTCGGTCTCAAGAAG-3′. PCR responses in a volume of 20 µL contain 2 µL primers, 1 µL extracted DNA,7 µL distilled water, and 10 µL Taq DNA Polymerase Master Mix (Amplicon; Denmark) in a DNA thermocycler. In the DNA thermocycler the DNA templates were denatured at 94°C for 4 minutes; strengthening include 35 rotations at 94°C, 58°C, and 72°C (each step for 30 seconds), and the last extension at 72°C for 7 minutes. Strengthened DNA (10 microliters) was added to 2 microliters of DRI restriction enzyme (Thermo Fisher Scientific, Waltham, MA, USA) at 37°C. PCR product electrophoresis was done on the agarose gel. Three segments of possible genotypes were obtained. These genotypes were GG (107 bp), GC (107,48 and 226 bp), and CC (155 and 226 bp).
Statistical analysis
All statistical analysis was performed by IBM SPSS version 23.0 (IBM Corp., Armonk, NY, USA). Statistical significance was considered as p < 0.05. Normality distribution was analyzed by Kolmogorov–Smirnov’s test (p > 0.05). The Hardy-Weinberg Equilibrium and comparison of categorical variables were assessed with the χ
2 test [
28]. Quantitative variables were reported as the means and SD and categorical characteristics information were reported as numbers and percentages. Comparison of numerical variables between tertiles of E-DII or CRY1 genotypes was determined using one-way analysis of variance (ANOVA) and analysis of covariance (ANCOVA) for adjusting confounders. Post hoc (Bonferroni) analyses, were determined for detecting a significant mean difference of variables among tertiles. For comparing categorical variables across tertiles, the χ
2 test was used. In order to examine the interactions between CRY1 genotypes and E-DII on the hs-CRP level, the participants were grouped based on CRY1 genotypes: group 1 with CC genotype, group 2 with CG genotype, and group 3 with GG genotype. Genotypes were reported based on risk allele as cumulative method: code 0 for GG (as the reference group), 1 for GC, and 2 for CC genotype then quantitative and categorical variables were assessed. The interaction between CRY1 genotypes and E-DII (as a continuous variable) on numerical variables was evaluated using generalized linear regression model analysis. Results were presented as beta (β) and 95% confidence intervals (CIs). In model 1, the interaction between CRY1 genotypes and DII was obtained after adjusting the age, physical activity, energy intake, and BMI. Model 2 was adjusted further for education and economic status.
RESULTS
Study population characteristics
This cross-sectional study was done on 220 adult women with central obesity by WHtR ≥ 0.5. No data was missed. The means and SD of age, BMI, and hs-CRP of participants were 35.61 (9.57) years, 30.97 (4.16) kg/m2, and 4.82 (5.16) mg/dL, respectively. The range E-DII was −3.32 to 3.19 (mean ± SD: 0.19 ± 1.5). The frequencies of CRY1 genotypes including CC, CG, and GG were 32.2%, 41.8%, and 26%, respectively.
Study the participant characteristics between tertiles of E-DII
The sociodemographic characteristics of participants among tertiles of E-DII were presented in
Table 1. The values of p for all variables were reported before the adjustment in the crude model and after the adjustment with potential confounders like age, physical activity, and energy intake. The WHR (p = 0.04) and physical activity mean (p = 0.006) were lower in the top tertile of the E-DII compared to the lowest tertile. The triglyceride values (p = 0.04) were higher in the top tertile of the E-DII compared to the lowest tertile. There was a significant association across tertiles of E-DII and economic status (p = 0.01), university education (p = 0.01), marriage (p = 0.01). There were no significant differences across tertiles of the E-DII in terms of other variables in this table. Post hoc (Bonferroni) analysis revealed physical activity has a significant difference between the first and third tertiles and the first with second tertiles. Also, WHR and triglyceride have a difference between first and third tertiles and first with second tertiles, respectively.
Table 1Characteristics of study population among tertiles of E-DII* in women with central obesity
Table 1
|
Variables |
E-DII tertiles |
p value†
|
p value‡
|
T1 (n = 78)
< −0.436 |
T2 (n = 64)
−0.436 to 0.884 |
T3 (n = 78)
0.884 < |
|
Age (yr) |
36.31 ± 1.30 |
35.45 ± 1.42 |
32.26 ± 1.33 |
0.075 |
0.086 |
|
PA (MET-minutes/wk) |
1,440.50 ± 167.44a,b
|
780.50 ± 185.79b
|
717.78 ± 175.56a
|
0.007
|
0.006
|
|
Anthropometric variables |
|
|
|
|
|
|
Weight (kg) |
82.27 ± 3.20 |
78.44 ± 3.52 |
75.78 ± 3.34 |
0.640 |
0.381 |
|
Height (cm) |
161.39 ± 1.53 |
160.95 ± 1.68 |
161.48 ± 1.59 |
0.163 |
0.974 |
|
WC (cm) |
88.15 ± 2.53 |
91.64 ± 2.78 |
97.18 ± 2.64 |
0.262 |
0.059 |
|
HC (cm) |
111.30 ± 2.19 |
112.20 ± 2.40 |
113.71 ± 2.28 |
0.607 |
0.875 |
|
BMI (kg/m2) |
28.43 ± 1.01 |
30.28 ± 1.11 |
31.91 ± 1.05 |
0.104 |
0.246 |
|
WHR |
0.85 ± 0.01a
|
0.81 ± 0.02 |
0.79 ± 0.01a
|
0.025
|
0.042
|
|
WHtR |
0.60 ± 0.01 |
0.57 ± 0.01 |
0.54 ± 0.01 |
0.133 |
0.052 |
|
Biochemical variables |
|
|
|
|
|
|
FBS (mg/dL) |
88.52 ± 1.12 |
87.57 ± 1.06 |
86.63 ± 1.12 |
0.169 |
0.498 |
|
Total cholesterol (mg/dL) |
184.76 ± 4.21 |
186.17 ± 4.01 |
185.33 ± 4.22 |
0.687 |
0.971 |
|
Triglyceride (mg/dL) |
111.46 ± 8.40b
|
139.51 ± 8.00b
|
112.67 ± 8.41 |
0.025
|
0.046
|
|
HDL-C (mg/dL) |
48.31 ± 1.29 |
45.44 ± 1.23 |
45.96 ± 1.29 |
0.299 |
0.246 |
|
LDL-C (mg/dL) |
97.03 ± 2.85 |
96.23 ± 2.71 |
92.83 ± 2.85 |
0.342 |
0.543 |
|
Categorical variables |
|
|
|
0.017
|
0.019
|
|
Economic status |
|
|
|
|
Low level |
41 (47.1) |
22 (25.3) |
24 (27.6) |
|
Moderate level |
58 (31.9) |
61 (33.5) |
63 (34.6) |
|
High level |
26 (24.3) |
42 (39.3) |
39 (36.4) |
|
Education level |
|
|
|
0.014
|
0.002
|
|
Illiterate |
1 (33.3) |
2 (66.7) |
0 (0.0) |
|
Under diploma |
15 (57.7) |
7 (26.9) |
4 (15.4) |
|
Diploma |
34 (39.1) |
27 (31.0) |
26 (29.9) |
|
Master and higher |
28 (26.9) |
28 (26.9) |
48 (46.2) |
|
Marital status |
|
|
|
0.013
|
0.752 |
|
Single |
59 (36.4) |
54 (33.3) |
49 (30.2) |
|
Married |
19 (32.8) |
10 (17.2) |
29 (50.0) |
|
CRY1 Genotype |
|
|
|
0.734 |
0.741 |
|
GG |
17 (31.5) |
14 (25.9) |
23 (42.6) |
|
CG |
33 (38.4) |
26 (30.2) |
27 (31.4) |
|
CC |
25 (37.3) |
20 (29.9) |
22 (32.8) |
Study the participant characteristics between genotypes of CRY1
The comparison of participant characteristics based on CRY1 genotypes was presented in
Table 2. The values of p were reported before and after adjusting the age, BMI, physical activity, and energy intake. The model was adjusted for age, physical activity, energy intake, and BMI. As well as, the amount of WHtR was more in the top tertiles of the CRY1 genotypes (CC) compared to the lowest tertile (GG) (mean ± SD: 0.59 ± 0.01, p = 0.02). Post hoc (Bonferroni) analysis revealed WHtR had a significant difference between first and third tertiles.
Table 2Participant characteristics between genotypes of CRY1 in women with central obesity
Table 2
|
Variables |
CRY1 genotypes |
p value*
|
p value†
|
|
GG (n = 54) |
CG (n = 87) |
CC (n = 67) |
|
Age (yr) |
34.63 ± 1.01 |
36.25 ± 0.88 |
37.51 ± 0.99 |
0.07 |
0.13 |
|
PA (MET-minutes/wk) |
837.84 ± 268.00 |
1,259.70 ± 233.67 |
1,592.26 ± 263.30 |
0.19 |
0.13 |
|
Anthropometric measurements |
|
|
|
|
|
|
Weight (kg) |
78.68 ± 0.87 |
78.37 ± 0.86b
|
80.27 ± 0.97b
|
0.04
|
0.32 |
|
Height (cm) |
161.13 ± 0.86 |
161.02 ± 0.85 |
162.37 ± 0.96 |
0.31 |
0.53 |
|
WC (cm) |
94.66 ± 1.52 |
95.05 ± 1.51 |
94.24 ± 1.69 |
0.05 |
0.44 |
|
HC (cm) |
112.21 ± 0.69 |
112.08 ± 0.69 |
113.43 ± 0.77 |
0.05 |
0.39 |
|
BMI (kg/m2) |
30.62 ± 0.46a
|
30.25 ± 0.40 |
31.32 ± 0.45a
|
0.04
|
0.21 |
|
WHR |
0.84 ± 0.01 |
0.84 ± 0.01 |
0.84 ± 0.01 |
0.91 |
0.19 |
|
WHtR |
0.57 ± 0.00a
|
0.59 ± 0.00 |
0.59 ± 0.01a
|
0.02
|
0.02
|
|
Blood parameters |
|
|
|
|
|
|
FBS (mg/dL) |
86.40 ± 1.44 |
86.01 ± 1.42 |
88.34 ± 1.60 |
0.59 |
0.53 |
|
Cholesterol (mg/dL) |
190.76 ± 5.70 |
183.46 ± 5.66 |
181.73 ± 6.35 |
0.95 |
0.52 |
|
TG (mg/dL) |
124.65 ± 12.18 |
119.01 ± 12.09 |
126.31 ± 13.57 |
0.62 |
0.91 |
|
HDL-C (mg/dL) |
46.42 ± 1.86 |
49.44 ± 1.85 |
43.09 ± 2.08 |
0.17 |
0.06 |
|
LDL-C (mg/dL) |
90.33 ± 3.93 |
93.88 ± 3.90 |
91.75 ± 4.38 |
0.97 |
0.81 |
|
Categorical variables |
|
|
|
|
|
|
Economic status |
|
|
|
0.01
|
0.39 |
|
|
Low level |
16 (28.6) |
22 (39.3) |
18 (32.1) |
|
|
Moderate level |
27 (27.6) |
49 (50.0) |
22 (22.4) |
|
|
High level |
11 (21.2) |
15 (28.8) |
26 (50.0) |
|
Education |
|
|
|
0.74 |
0.77 |
|
|
Illiterate |
2 (66.7) |
1 (33.3) |
0 (0.0) |
|
|
Under diploma |
7 (29.2) |
10 (41.7) |
7 (29.2) |
|
|
Diploma |
20 (23.8) |
37 (44.0) |
27 (32.1) |
|
|
Master and upper |
25 (25.8) |
39 (40.2) |
33 (34.0) |
|
Marital status |
|
|
|
0.51 |
0.48 |
|
|
Single |
20 (31.3) |
25 (39.1) |
19 (29.7) |
|
|
Married |
34 (23.6) |
62 (43.1) |
48 (33.3) |
Study the values of the hs-CRP level of participants
The level of hs-CRP among E-DII tertiles and CRY1 genotypes in women with central obesity was presented in
Table 3. The values of p were reported before and after adjusting the potential confounders. Model 1 was adjusted for age, physical activity, energy intake, and BMI. Model 2 was adjusted further for education and economic status. Model 2 showed that CRY1 genotypes have a significant association with hs-CRP level (mean ± SD: 3.25 ± 0.78, p = 0.03). Post hoc (Bonferroni) analysis revealed the values of hs-CRP were higher in the CG compared to the GG.
Table 3The level of high-sensitivity C-reactive protein (mg/dL) among E-DII tertiles and CRY1 genotypes in women with central obesity
Table 3
|
Models |
E-DII tertile |
CRY1 genotypes |
T1 (n = 78)
< −0.436 |
T2 (n = 64)
−0.436 to 0.884 |
T3 (n = 78)
0.884 < |
p value*
|
p value†
|
GG (n = 54) |
CG (n = 87) |
CC (n = 67) |
p value*
|
p value†
|
|
Crude |
4.26 ± 4.80 |
5.77 ± 5.10 |
4.55 ± 5.55 |
0.46 |
|
4.13 ± 3.76 |
3.96 ± 4.11 |
4.13 ± 3.76 |
0.47 |
|
|
Model 1 |
4.08 ± 1.03 |
6.18 ± 1.01 |
4.54 ± 0.95 |
|
0.32 |
3.64 ± 0.68 |
3.92 ± 0.68 |
3.64 ± 0.68 |
|
0.48 |
|
Model 2 |
4.11 ± 0.97 |
5.90 ± 0.95 |
5.03 ± 0.91 |
|
0.40 |
3.21 ± 0.77b
|
3.76 ± 0.78b
|
3.25 ± 0.78 |
|
0.03
|
The interaction of cry1 genotypes and E-DII on hs-CRP
Interaction between CRY1 genotypes and E-DII on the level of hs-CRP using a generalized linear model was reported in
Table 4. Model 1 was adjusted for age, physical activity, energy intake, and BMI. Model 2 was adjusted further for education and economic status. Interaction between the E-DII score and CG in comparison with the reference group (GG) had significant association with higher hs-CRP level, in the crude model (β, 1.30; 95% CI, 0.23–2.36; p = 0.01), model 1 (β, 1.19; 95% CI, 0.11–2.27; p = 0.03), and model 2 (β, 1.21; 95% CI, 0.15–2.40; p = 0.04). The interaction between increasing of E-DII score and CC in comparison with the reference group (GG) had a marginally significant association with a higher level of hs-CRP, before the adjustment (β, 0.95; 95% CI, −0.04 to 1.94; p = 0.06). There was a marginally significant interaction between the E-DII score and CC in comparison with the reference group (GG) on the level of hs-CRP after adjusting the potential confounders such as age, physical activity, energy intake, and BMI (β, 0.85; 95% CI, −0.15 to 1.86; p = 0.05). In model 2 with further adjustment for education and economic status, the same results of model 1 were obtained. No other significant relation was seen in
Table 4. The interaction between CRY1 genotypes and E-DII adherence on the level of hs-CRP was shown in the crude model in
Figure 1.
Table 4Interaction between E-DII and polymorphism of CRY1 gene on high-sensitivity C-reactive protein levels in women with central obesity
Table 4
|
Genotypes*E-DII |
β |
95% CI |
p value |
|
Crude model |
|
|
|
|
CC*E-DII |
0.95 |
−0.04 to 1.94 |
0.06
|
|
CG*E-DII |
1.30 |
0.23 to 2.36 |
0.01
|
|
GG*E-DII*
|
Ref |
- |
- |
|
Model 1 |
|
|
|
|
CC*E-DII |
0.85 |
−0.15 to 1.86 |
0.05
|
|
CG*E-DII |
1.19 |
0.11 to 2.27 |
0.03
|
|
GG*E-DII*
|
Ref |
- |
- |
|
Model 2 |
|
|
|
|
CC*E-DII |
0.85 |
−0.15 to 1.88 |
0.05 |
|
CG*E-DII |
1.21 |
0.15 to 2.40 |
0.04 |
|
GG*E-DII |
Ref |
- |
- |
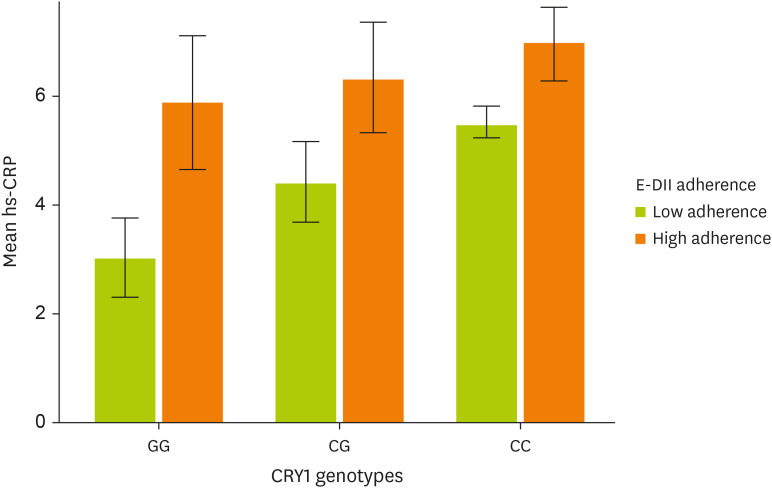
Figure 1
Interaction between CRY1 genotypes (CC and CG) and E-DII on the mean of hsCRP level in crude model. GG genotype is a reference group.
p value for CC and CG genotype are respectively; 0.22 and 0.89. p value for E-DII adherence: 0.14. p value for interaction between E-DII and CC genotype: 0.06. p value for interaction between E-DII and CG genotype: 0.01.
hs-CRP, high-sensitivity C-reactive protein; CRY1, cryptochrome circadian clocks 1; E-DII, energy-adjusted dietary inflammatory index.
DISCUSSION
This cross-sectional study examined the interaction between CRY1 polymorphism and dietary inflammatory index on the hs-CRP level in women with central obesity. Our results indicated the interaction between the CG genotype, CC genotype, and the DII score on the level of hs-CRP was positively significant. Generally, women with central obesity and risk allele (C) of the CRY1 genotype, also higher adherence to DII had a higher level of hs-CRP.
The circadian clock may affect the function and activity of the immune system, inflammation [
29], and obesity [
12]. Also, the dietary inflammatory index is used for assessing the inflammatory effects of diet [
30]. Inflammation is a common cause of chronic diseases [
31], and to the best of our knowledge, no study has investigated the interaction between CRY1 polymorphism and DII on the hs-CRP level in women with central obesity. Therefore, assessing this interaction seems important.
The present study revealed the interaction of CG genotype, CC genotype, and DII score has a significant association with higher levels of hs-CRP. No study has assessed this association. But as we know, increasing consumption of fruits and vegetables [
32,
33,
34], nuts [
35], legumes [
36], and low-fat dairy [
35] has a significant association with a lower level of hs-CRP. However, in higher DII scores intake of the aforementioned foods, decreases; and the intake of saturated fatty acids has increased [
37], therefore, the level of hs-CRP is higher [
38]. But the results of the studies are inconsistent. Some studies presented a significant association between DII, central obesity, and inflammation [
39,
40,
41]; other ones have reported no significant association between DII and central obesity and inflammation [
42,
43]. On the other hand, diet composition affects circadian function. It is unclear how diet composition can affect circadian genes, but several observations show a possible mechanism is epigenetic. It has been demonstrated that consumption of a Western diet (a diet with more pro-inflammatory potential), can affect circadian genes and encode important metabolic settings of genes. In line with our results, a previous study showed that high fat and high carbohydrate diet alters the peripheral rhythmic of inflammatory biomarkers secretion and the serum levels of hs-CRP and core clock gene expression which induced obesity in a mouse model [
44]. This kind of diet decreases NAD
+ levels due to reducing nicotinamide phosphoribosyl transferase expression [
45] and diminishes acetyl-CoA content [
46] while elevating long-chain free fatty acids that increase activation of the deacetylase activity of SIRT6 [
47], which affects the circadian metabolic processes. Another epigenetic setting is the ketone body Beta-hydroxybutyrate, which contributes to a circadian regulator of lipid metabolism [
48]. A high protein and ketogenic diet lead to an increase in the expression of some of the circadian genes too [
49,
50]. High-fat diet-induced obesity destroyed the daily rhythm of circadian genes and disrupts microglial immune metabolic functions [
51]. Clock genes via setting transcription of major genes for lipid metabolism enzymes, such as hormone-sensitive lipase (HSL), and triglyceride lipase (Atgl) in white adipose tissue; have a vital role in energy metabolism and obesity [
52]. As known, the secretion of many pro-inflammatory cytokines has a diurnal variation in which its peak levels are in the rest phase (dark phase) in humans [
53]. Also, cytokine receptors can express rhythmically [
54]. According to evidence, a bidirectional setting is between CRY clock genes and TNF-a, CRY1 can decrease the activation rate of the TNF-a gene directly [
55]. TNF-a might be involved in the expression of the time-dependent setting of the clock gene [
56] and can affect the suprachiasmatic nucleus (SCN) [
57]. SCN is connected to neural pathways setting the immune response and has a close relationship with the paraventricular nucleus and the arcuate nucleus which have a connection to peripheral circadian entrainment and immune tasks [
58]. Indeed, the ablation of CRY1 increases pro-inflammatory cytokines in a cell-autonomous way. CRY1 protein fixes adenylyl cyclase and restricts cAMP production. Lack of CRY1 protein might increase cAMP and elevate PKA activation, as a result, NF-κ B becomes active via phosphorylation of p65 at S276 [
16]. According to the above-mentioned mechanisms, it is possible to clarify the findings.
This study has shown that by increasing the number of the risk allele (C) in genotypes of CRY1, and higher adherence to DII, the level of hs-CRP was significantly higher in women with central obesity. A study on polymorphisms in circadian genes with abdominal obesity showed significant associations between haplotypes of CG for CLOCK rs10002541 and rs4864546 with abdominal obesity [
15]. Also, an investigation on mice showed that mice deficient in CRY1 inhibits high-fat diet (HFD)-induced obesity, therefore CRY1 had an important role in central obesity [
59]. This gene has an association with inflammation likely via relation to NF-κB and cAMP/PKA pathways [
60]. Takahashi et al. [
61] reported that the circadian clocks adjust many facets of the immune system, therefore disturbance of them leads to various inflammatory-related diseases and increased blood inflammatory factors. Several studies reported that the CRY gene could have a robust relationship with inflammation [
16,
60,
62].
Strengths of the recent study were: data collection and measurements were done by a dietitian, the use of questionnaires with proven validity and reliability, therefore all measurements were accurate. This study reported novel findings regarding the interaction between the dietary inflammatory index and CRY1 gene variants on the level of hs-CRP and central obesity. Some limitations have been considered. Because of the cross-sectional study design, the temporal sequence and causal relationship could not be determined. All subjects included in this study were Iranians therefore, the results of this study might not be generalizable to people all over the world. Also, we recurred only women in this study therefore, the results of this study might not be generalizable to all members of society. The sample size of this study was relatively small. Using the FFQ questionnaire to obtain data on the dietary intakes of participants depends on the memory of subjects and could create an error in our results. The measurement error and classification of subjects could not be removed from the study. Despite adjusting several potential confounders in this study, the effects of the remaining distortions were uncontrollable.
There is probably positive interaction between CG, CC genotypes of CRY1, and E-DII score on the level of hs-CRP in women with central obesity. Further studies with prospective designs on specific populations in this field are suggested.
Tehran University of Medical Sciences and Health Serviceshttps://doi.org/10.13039/501100004484
IR.TUMS.VCR.REC.1398.051
NOTES
-
Funding: This study is funded by grants from the Tehran University of Medical Sciences (TUMS). (Grant ID: IR.TUMS.VCR.REC.1398.051). The funder had no role in the study design, data collection, and analysis, decision to publish, or preparation of the manuscript.
-
Conflict of Interest: The authors declare that they do not have any conflict of interest. We declare that none of the authors listed on the manuscript are employed by a government agency that has a primary function other than research and/or education. Also, we declare that none of the authors are submitting this manuscript as an official representative or on behalf of the government.
-
Author Contributions:
Conceptualization: Asgari E, Shiraseb F, Mirzababaei A, Mirzaei K.
Data curation: Tangestani H.
Formal analysis: Shiraseb F.
Investigation: Asgari E.
Methodology: Asgari E, Shiraseb F, Mirzababaei A.
Project administration: Mirzaei K.
Resources: Mirzaei Kh.
Software: Shiraseb F.
Supervision: Mirzaei K.
Validation: Mirzaei K.
Visualization: Asgari E, Shiraseb F.
Writing - original draft: Asgari E.
Writing - review & editing: Asgari E, Shiraseb F, Mirzababaei A, Tangestani H, Mirzaei K.
ACKNOWLEDGEMENTS
We are extremely grateful to all the participants who took part in this study and the school of Nutritional and Dietetics at Tehran University of medical sciences.
REFERENCES
- 1. Bertoli S, Leone A, Vignati L, Bedogni G, Martínez-González MÁ, Bes-Rastrollo M, Spadafranca A, Vanzulli A, Battezzati A. Adherence to the Mediterranean diet is inversely associated with visceral abdominal tissue in Caucasian subjects. Clin Nutr 2015;34:1266-1272.
- 2. Wong MC, Huang J, Wang J, Chan PS, Lok V, Chen X, Leung C, Wang HH, Lao XQ, Zheng ZJ. Global, regional and time-trend prevalence of central obesity: a systematic review and meta-analysis of 13.2 million subjects. Eur J Epidemiol 2020;35:673-683.
- 3. Barak F, Falahi E, Keshteli AH, Yazdannik A, Esmaillzadeh A. Adherence to the Dietary Approaches to Stop Hypertension (DASH) diet in relation to obesity among Iranian female nurses. Public Health Nutr 2015;18:705-712.
- 4. Engin A. The definition and prevalence of obesity and metabolic syndrome. Adv Exp Med Biol 2017;960:1-17.
- 5. Muhammad HF, van Baak MA, Mariman EC, Sulistyoningrum DC, Huriyati E, Lee YY, Wan Muda WA. Dietary inflammatory index score and its association with body weight, blood pressure, lipid profile, and leptin in Indonesian adults. Nutrients 2019;11:148.
- 6. Hermsdorff HH, Zulet MA, Puchau B, Martínez JA. Central adiposity rather than total adiposity measurements are specifically involved in the inflammatory status from healthy young adults. Inflammation 2011;34:161-170.
- 7. Ashwell M, Gunn P, Gibson S. Waist-to-height ratio is a better screening tool than waist circumference and BMI for adult cardiometabolic risk factors: systematic review and meta-analysis. Obes Rev 2012;13:275-286.
- 8. Stoffel NU, El-Mallah C, Herter-Aeberli I, Bissani N, Wehbe N, Obeid O, Zimmermann MB. The effect of central obesity on inflammation, hepcidin, and iron metabolism in young women. Int J Obes 2020;44:1291-1300.
- 9. Barrea L, Di Somma C, Muscogiuri G, Tarantino G, Tenore GC, Orio F, Colao A, Savastano S. Nutrition, inflammation and liver-spleen axis. Crit Rev Food Sci Nutr 2018;58:3141-3158.
- 10. Lee H, Lee IS, Choue R. Obesity, inflammation and diet. Pediatr Gastroenterol Hepatol Nutr 2013;16:143-152.
- 11. Abdurahman AA, Azadbakhat L, Rasouli M, Chamari M, Qorbani M, Dorosty AR. Association of dietary inflammatory index with metabolic profile in metabolically healthy and unhealthy obese people. Nutr Diet 2019;76:192-198.
- 12. Scott EM, Carter AM, Grant PJ. Association between polymorphisms in the Clock gene, obesity and the metabolic syndrome in man. Int J Obes 2008;32:658-662.
- 13. Cermakian N, Westfall S, Kiessling S. Circadian clocks and inflammation: reciprocal regulation and shared mediators. Arch Immunol Ther Exp (Warsz) 2014;62:303-318.
- 14. Renström F, Koivula RW, Varga TV, Hallmans G, Mulder H, Florez JC, Hu FB, Franks PW. Season-dependent associations of circadian rhythm-regulating loci (CRY1, CRY2 and MTNR1B) and glucose homeostasis: the GLACIER Study. Diabetologia 2015;58:997-1005.
- 15. Ye D, Cai S, Jiang X, Ding Y, Chen K, Fan C, Jin M. Associations of polymorphisms in circadian genes with abdominal obesity in Chinese adult population. Obes Res Clin Pract 2016;10(Suppl 1):S133-S141.
- 16. Narasimamurthy R, Hatori M, Nayak SK, Liu F, Panda S, Verma IM. Circadian clock protein cryptochrome regulates the expression of proinflammatory cytokines. Proc Natl Acad Sci U S A 2012;109:12662-12667.
- 17. Clemenzi MN, Martchenko A, Loganathan N, Tse EK, Brubaker PL, Belsham DD. Analysis of Western diet, palmitate and BMAL1 regulation of neuropeptide Y expression in the murine hypothalamus and BMAL1 knockout cell models. Mol Cell Endocrinol 2020;507:110773.
- 18. Willett W. Issues in analysis and presentation of dietary data. Nutritional epidemiology 1998;321-346.
- 19. Browning LM, Hsieh SD, Ashwell M. A systematic review of waist-to-height ratio as a screening tool for the prediction of cardiovascular disease and diabetes: 0·5 could be a suitable global boundary value. Nutr Res Rev 2010;23:247-269.
- 20. Ashwell M, Hsieh SD. Six reasons why the waist-to-height ratio is a rapid and effective global indicator for health risks of obesity and how its use could simplify the international public health message on obesity. Int J Food Sci Nutr 2005;56:303-307.
- 21. World Health Organization. Preventing and managing the global epidemic. Report of a WHO consultation on obesity. Geneva: World Health Organization; 1997, pp 17-40.
- 22. World Health Organization. Obesity: preventing and managing the global epidemic. Geneva: World Health Organization; 2000.
- 23. Mollahosseini M, Rahimi MH, Yekaninejad MS, Maghbooli Z, Mirzaei K. Dietary patterns interact with chromosome 9p21 rs1333048 polymorphism on the risk of obesity and cardiovascular risk factors in apparently healthy Tehrani adults. Eur J Nutr 2020;59:35-43.
- 24. Ghaffarpour M, Houshiar-Rad A, Kianfar H. The manual for household measures, cooking yields factors and edible portion of foods. Tehran: Publication of Agricultural Sciences; 1999, p 213.
- 25. Mirzababaei A, Ghodoosi N, Pooyan S, Djafarian K, Clark CC, Mirzaei K. The interaction between the dietary inflammatory index and MC4R gene variants on cardiovascular risk factors. Clin Nutr 2021;40:488-495.
- 26. Shivappa N, Steck SE, Hurley TG, Hussey JR, Hébert JR. Designing and developing a literature-derived, population-based dietary inflammatory index. Public Health Nutr 2014;17:1689-1696.
- 27. Maddahi N, Yarizadeh H, Aghamir SK, Moddaresi S, Alizadeh S, Yekaninejad M, Mirzaei K. The association of dietary inflammatory index with urinary risk factors of kidney stones formation in men with nephrolithiasis. BMC Res Notes 2020;13:373.
- 28. Mirzababaei A, Daneshzad E, Shiraseb F, Pourreza S, Setayesh L, Clark CC, Tangestani H, Abaj F, Yarizadeh H, Mirzaei K. Variants of the cry 1 gene may influence the effect of fat intake on resting metabolic rate in women with overweight of obesity: a cross-sectional study. BMC Endocr Disord 2021;21:196.
- 29. Labrecque N, Cermakian N. Circadian clocks in the immune system. J Biol Rhythms 2015;30:277-290.
- 30. Vahid F, Shivappa N, Hekmatdoost A, Hebert JR, Davoodi SH, Sadeghi M. Association between Maternal Dietary Inflammatory Index (DII) and abortion in Iranian women and validation of DII with serum concentration of inflammatory factors: case-control study. Appl Physiol Nutr Metab 2017;42:511-516.
- 31. Laveti D, Kumar M, Hemalatha R, Sistla R, Naidu VG, Talla V, Verma V, Kaur N, Nagpal R. Anti-inflammatory treatments for chronic diseases: a review. Inflamm Allergy Drug Targets 2013;12:349-361.
- 32. Esmaillzadeh A, Kimiagar M, Mehrabi Y, Azadbakht L, Hu FB, Willett WC. Fruit and vegetable intakes, C-reactive protein, and the metabolic syndrome. Am J Clin Nutr 2006;84:1489-1497.
- 33. Root MM, McGinn MC, Nieman DC, Henson DA, Heinz SA, Shanely RA, Knab AM, Jin F. Combined fruit and vegetable intake is correlated with improved inflammatory and oxidant status from a cross-sectional study in a community setting. Nutrients 2012;4:29-41.
- 34. Hermsdorff HH, Zulet MÁ, Puchau B, Martínez JA. Fruit and vegetable consumption and proinflammatory gene expression from peripheral blood mononuclear cells in young adults: a translational study. Nutr Metab (Lond) 2010;7:42.
- 35. Casas-Agustench P, López-Uriarte P, Bulló M, Ros E, Cabré-Vila JJ, Salas-Salvadó J. Effects of one serving of mixed nuts on serum lipids, insulin resistance and inflammatory markers in patients with the metabolic syndrome. Nutr Metab Cardiovasc Dis 2011;21:126-135.
- 36. Hermsdorff HH, Zulet MA, Abete I, Martínez JA. A legume-based hypocaloric diet reduces proinflammatory status and improves metabolic features in overweight/obese subjects. Eur J Nutr 2011;50:61-69.
- 37. Santos S, Oliveira A, Casal S, Lopes C. Saturated fatty acids intake in relation to C-reactive protein, adiponectin, and leptin: a population-based study. Nutrition 2013;29:892-897.
- 38. Cavicchia PP, Steck SE, Hurley TG, Hussey JR, Ma Y, Ockene IS, Hébert JR. A new dietary inflammatory index predicts interval changes in serum high-sensitivity C-reactive protein. J Nutr 2009;139:2365-2372.
- 39. Sokol A, Wirth MD, Manczuk M, Shivappa N, Zatonska K, Hurley TG, Hébert JR. Association between the dietary inflammatory index, waist-to-hip ratio and metabolic syndrome. Nutr Res 2016;36:1298-1303.
- 40. Hermsdorff HH, Zulet MÁ, Puchau B, Martínez JA. Central adiposity rather than total adiposity measurements are specifically involved in the inflammatory status from healthy young adults. Inflammation 2011;34:161-170.
- 41. Kim HY, Lee J, Kim J. Association between dietary inflammatory index and metabolic syndrome in the general Korean population. Nutrients 2018;10:648.
- 42. Neufcourt L, Assmann KE, Fezeu LK, Touvier M, Graffouillère L, Shivappa N, Hébert JR, Wirth MD, Hercberg S, Galan P, Julia C, Kesse-Guyot E. Prospective association between the dietary inflammatory index and metabolic syndrome: findings from the SU.VI.MAX study. Nutr Metab Cardiovasc Dis 2015;25:988-996.
- 43. Ghorabi S, Esteghamati A, Azam K, Daneshzad E, Sadeghi O, Salari-Moghaddam A, Azadbakht L, Djafarian K. Association between dietary inflammatory index and components of metabolic syndrome. J Cardiovasc Thorac Res 2020;12:27-34.
- 44. DiTacchio L. The interplay between diet, epigenetics and the circadian clock. In: Ferguson BS, editor. Nutritional epigenomics. Amsterdam: Elsevier; 2019, pp 203-210.
- 45. Yoshino J, Mills KF, Yoon MJ, Imai S. Nicotinamide mononucleotide, a key NAD(+) intermediate, treats the pathophysiology of diet- and age-induced diabetes in mice. Cell Metab 2011;14:528-536.
- 46. Carrer A, Parris JL, Trefely S, Henry RA, Montgomery DC, Torres A, Viola JM, Kuo YM, Blair IA, Meier JL, Andrews AJ, Snyder NW, Wellen KE. Impact of a high-fat diet on tissue Acyl-CoA and histone acetylation levels. J Biol Chem 2017;292:3312-3322.
- 47. Feldman JL, Baeza J, Denu JM. Activation of the protein deacetylase SIRT6 by long-chain fatty acids and widespread deacylation by mammalian sirtuins. J Biol Chem 2013;288:31350-31356.
- 48. Shimazu T, Hirschey MD, Newman J, He W, Shirakawa K, Le Moan N, Grueter CA, Lim H, Saunders LR, Stevens RD, Newgard CB, Farese RV Jr, de Cabo R, Ulrich S, Akassoglou K, Verdin E. Suppression of oxidative stress by β-hydroxybutyrate, an endogenous histone deacetylase inhibitor. Science 2013;339:211-214.
- 49. Tognini P, Murakami M, Liu Y, Eckel-Mahan KL, Newman JC, Verdin E, Baldi P, Sassone-Corsi P. Distinct circadian signatures in liver and gut clocks revealed by ketogenic diet. Cell Metab 2017;26:523-538.e5.
- 50. Genzer Y, Dadon M, Burg C, Chapnik N, Froy O. Ketogenic diet delays the phase of circadian rhythms and does not affect AMP-activated protein kinase (AMPK) in mouse liver. Mol Cell Endocrinol 2015;417:124-130.
- 51. Milanova IV, Kalsbeek MJ, Wang XL, Korpel NL, Stenvers DJ, Wolff SE, de Goede P, Heijboer AC, Fliers E, la Fleur SE, Kalsbeek A, Yi CX. Diet-induced obesity disturbs microglial immunometabolism in a time-of-day manner. Front Endocrinol (Lausanne) 2019;10:424.
- 52. Shostak A, Meyer-Kovac J, Oster H. Circadian regulation of lipid mobilization in white adipose tissues. Diabetes 2013;62:2195-2203.
- 53. Guan Z, Vgontzas AN, Omori T, Peng X, Bixler EO, Fang J. Interleukin-6 levels fluctuate with the light-dark cycle in the brain and peripheral tissues in rats. Brain Behav Immun 2005;19:526-529.
- 54. Sadki A, Bentivoglio M, Kristensson K, Nygård M. Suppressors, receptors and effects of cytokines on the aging mouse biological clock. Neurobiol Aging 2007;28:296-305.
- 55. Hashiramoto A, Yamane T, Tsumiyama K, Yoshida K, Komai K, Yamada H, Yamazaki F, Doi M, Okamura H, Shiozawa S. Mammalian clock gene Cryptochrome regulates arthritis via proinflammatory cytokine TNF-α. J Immunol 2010;184:1560-1565.
- 56. Yoshida K, Hashiramoto A, Okano T, Yamane T, Shibanuma N, Shiozawa S. TNF-α modulates expression of the circadian clock gene Per2 in rheumatoid synovial cells. Scand J Rheumatol 2013;42:276-280.
- 57. Leone MJ, Marpegan L, Duhart JM, Golombek DA. Role of proinflammatory cytokines on lipopolysaccharide-induced phase shifts in locomotor activity circadian rhythm. Chronobiol Int 2012;29:715-723.
- 58. Kalsbeek A, Buijs RM. Output pathways of the mammalian suprachiasmatic nucleus: coding circadian time by transmitter selection and specific targeting. Cell Tissue Res 2002;309:109-118.
- 59. Griebel G, Ravinet-Trillou C, Beeské S, Avenet P, Pichat P. Mice deficient in cryptochrome 1 (cry1 (-/-)) exhibit resistance to obesity induced by a high-fat diet. Front Endocrinol (Lausanne) 2014;5:49.
- 60. Qin B, Deng Y. Overexpression of circadian clock protein cryptochrome (CRY) 1 alleviates sleep deprivation-induced vascular inflammation in a mouse model. Immunol Lett 2015;163:76-83.
- 61. Takahashi JS, Hong HK, Ko CH, McDearmon EL. The genetics of mammalian circadian order and disorder: implications for physiology and disease. Nat Rev Genet 2008;9:764-775.
- 62. Hand LE, Hopwood TW, Dickson SH, Walker AL, Loudon AS, Ray DW, Bechtold DA, Gibbs JE. The circadian clock regulates inflammatory arthritis. FASEB J 2016;30:3759-3770.