ABSTRACT
Following up with recovered coronavirus disease 2019 (COVID-19) patients is necessary. Given the importance of psychological function accompanied by significant effects of food quality, we want to examine the association between food quality score (FQS) and mental disorders among recovered COVID-19 patients. This case-control study was performed on 246 eligible adults. A validated food frequency questionnaire (FFQ) was used to evaluate dietary intake. We using Depression Anxiety Stress Scales, Insomnia Severity Index, Pittsburgh Sleep Quality Index, and 36-Item Short Form Health Survey questionnaires to evaluate the psychological function. Logistic regression analysis was conducted to estimate the odds ratio (OR) and 95% confidence intervals (CIs) for score categories of the FQS index and psychological function in multivariate-adjusted models. Only in case subjects, we found significant associations between adherence to the FQS diet and depression, anxiety, and stress in the crude model (OR, 0.796, 95% CI, 0.661–0.958, p = 0.016; OR, 0.824, 95% CI, 0.707–0.960, p = 0.013; OR, 0.824, 95% CI, 0.709–0.956, p = 0.011, respectively). These associations remained significant in all two adjusted models. However, no significant associations were found between FQS and psychological functions in the control group. Our data suggests that overall food quality intake is associated with depression, anxiety, and stress symptoms during the post-infection period. Also, adequate daily intakes of fruits, legumes, nuts, and whole grains are associated with reduced risks of psychological impairment and sleep disorders which are common among recovered patients.
-
Keywords: Food quality; Mental disorders; Depression; Anxiety; COVID-19
INTRODUCTION
Severe acute respiratory syndrome coronavirus 2 (SARS-CoV-2) is a health problem that first emerged at the end of 2019, resulting in healthcare crises and increased morbidity and mortality rate all over the world [
1]. A cohort study evaluating 6-month neurological and psychiatric incidence in coronavirus disease 2019 (COVID-19) survivors mentioned 33.62% of diagnoses [
2]. Confusion, depression, anxiety, insomnia, impaired memory, and less mania and psychosis induced by steroids are the most reported symptoms during the acute stage of COVID-19 infection among hospitalized patients. However, studies regarding psychological function among COVID-19 patients during the post-infection period are lacking.
It has been shown that some nutrients such as vitamin D, food groups including vegetables and fruits, and also diets like the Mediterranean diet positively impact psychological function and reduce the risk of mental disorders [
3]. Altogether, insufficient food intake among recovered COVID-19 patients may negatively affect their mental health. Not only a single nutrient but all dietary nutrients that represent the diet quality of a person are important for mental well-being.
Food quality scores (FQS) that are based on food intake including 14 food items and groups (divided into two groups: healthy foods including legumes, nuts, fruits, whole grains, vegetables, coffee, and yogurt and unhealthy foods including fried food, potato chips, potato, processed meats, red meats, butter, refined grains, ice cream, sugar-sweetened beverages, and desserts) and are proper choices for assessing the possible associations. FQS items, altogether evaluate the overall diet quality that a higher FQS recognized healthier and better diet [
4].
As a result, due to the importance of psychological impairment during hospitalization and recovery in COVID-19 patients and also, the significant role of food quality on neurological and psychological health, we aimed to assess the relationship between food quality score and mental disorders between recovered COVID-19 patients . To date according to our knowledge, no study exists regarding this possible relationship.
METHODS AND MATERIALS
Study design
The current case-control study involved adults aged 30 years or more who were admitted to the clinic of Qaem Hospital in Mashhad, Iran from November 2020 to January 2021. Eligible cases were all incident cases of COVID-19 within the past 1 month. Every participant had negative polymerase chain reaction (PCR) tests or computed tomography (CT) scans at the time of the interview without history of mental disease before interview. The exclusion criteria for controls were the cases of taking an anti-depressant drug treatment during the last 6 months, having cancer, renal or hepatic failure, autoimmune diseases, or metabolic bone disease, and having particular dietary habits like vegetarians.
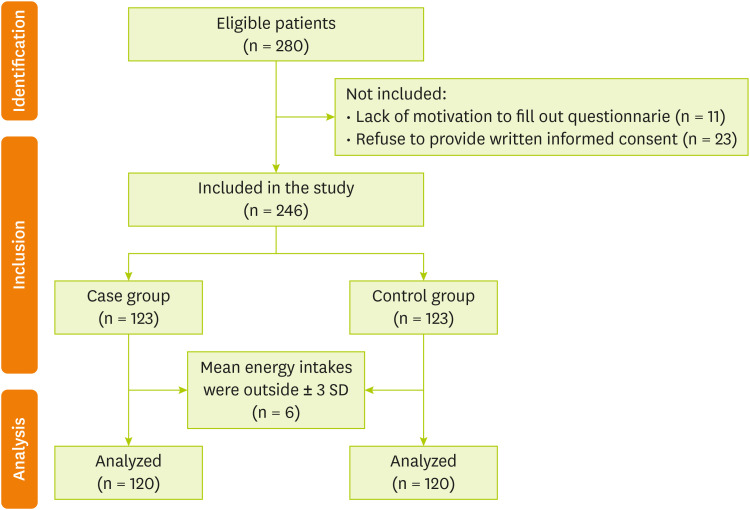
The control group was randomly selected among adults over 30 years old with no prior history of COVID-19 infection, who were referred to the nutrition clinic of Qaem Hospital. Controls were excluded based on the criterion of having a history of COVID-19 diagnosed with a CT scan or PCR, autoimmune diseases, anti-depressant drug treatment 6 months ago, cancer, hepatic or renal failure, metabolic bone disease, having particular dietary habits, and autoimmune diseases. One control was registered for every case and matched for Gender and age (± 5 years). Of the 246 qualified participants in the current study, 240 subjects (120 controls and 120 cases) were included in the final analysis. Three cases and three controls were excluded from the study due to their mean energy intakes were outside ± 3 standard deviation (SD).
Figure 1 shows the diagram of the study subjects. All subjects provided written informed consent. The present study was approved by the Ethics Committee of MUMS (Mashhad University of Medical Sciences), Mashhad, Iran (Ethic Number: IR.MUMS.REC.1399.237).
Figure 1Flow diagram of participants.
General and anthropometric characteristics
A trained nurse collected anthropometric and demographic characteristics, including age, race, height, weight, and level of education. We used the calibrated personal scale for weight measurement. To measure the height, we used fixed measuring tape on the wall. We applied the following formula for calculating body mass index: body weight (kg)/body height (m2).
Dietary assessment
We used a valid 68-item semi-quantitative FFQ to find out the food consumed during the last year [
5]. Trained dietitians asked the subjects to describe how often they consumed each food item over the past year, using categories of daily, weekly, monthly, rarely, or never. Food analysis was undertaken using Diet Plan 6 software (Forest Field Software Ltd, Horsham, UK). For scoring food quality, we apply the method defined by Fung et al. [
6]. Fourteen components considered in the FQS: whole grains, legumes, nuts, vegetables, fruits, yogurt, and coffee, that are known as healthy food groups and processed meats, red meats, sugar-sweetened beverages, refined grains, ice cream, desserts fried food, butter, potato, and potato chips were classified as unhealthy food groups. Then, we ranked individual consumptions into tertiles and allocated scores between 1 and three for healthy foods groups and allocated reversed tertile rankings (scores between 3 and 1) for unhealthy foods groups. Finally, the scores from each food group were summed and overall FQS ranged between 14 to 42. A higher score indicates a healthier dietary pattern.
The DASS is a questionnaire for mood status [
7]. This is a valid tool that includes 21 items. Every question is rated on a four-point Likert scale (0–3) to recognize the severity of depression, anxiety, and stress. A lower score demonstrates a lower degree of negative emotion. The scores for stress anxiety and depression were divided into 2 categories: No or minimal scores and some degree of mood disorder. Regarding the scores achieved every subscale was determined as follows: (score ≤ 9, No), (score > 9, some degree of depression), (score ≤ 7, No), (score > 7, some degree of anxiety), (score ≤ 14, No), (score > 14 some degree of stress). previously has been reported the validity and reliability of DASS in the Iranian population [
8].
The ISI is a self-report questionnaire that consists of seven-item to assess the symptoms of insomnia and their consequences. The dimensions assessed include sleeping disturbances associated with anxiety, satisfaction with current sleep patterns, and the intensity of sleep disorders [
9]. Every item is scored on a scale of 0–4. The overall score ranged from 0 to 28 and was described as follows: no insomnia (0–7), mild to severe insomnia (8–28). In this study, we used the valid Persian version of this tool for the Iranian population (Cronbach’s alpha > 0.8 and intra-class correlation coefficient > 0.7) [
10].
PSQI questionnaire is a self-reported tool that consists of 19 items to examine sleep quality over the last 30 days [
11]. This questionnaire consists of 7 component scores including sleep disturbances, use of sleep medication, daytime dysfunction, habitual sleep efficiency, sleep duration, subjective sleep quality, and sleep latency. The answers are scored on a 3-point scale (0–3). So, the total score for sleep quality ranges from 0 to 21. Participants were divided into two groups based on their PSQI score: the poor-sleeper group (PSQI > 5) and the good-sleeper group (PSQI ≤ 5). Farrahi Moghaddam et al validated the Persian version of PSQI in 2012 [
12].
We used the 36-Item Short Form Health Survey (SF-36) as a valid tool for evaluating general quality of life. Scores of this questionnaire range from 0 to 100. validity of the Persian version of SF-36 were examined in the previous [
13].
Statistical analysis was run by Statistical Package for Social Sciences (SPSS) Statistics for Windows v20 (IBM Corp., Armonk, NY, USA). The Kolmogorov– Smirnov test was used to analyze the normality of variables. Normally distributed variables were expressed as mean and SD and non-normally distributed variables were expressed as median and interquartile range. As the median FQS score was 27 in this study, we divided people into below and above 27 to check people’s adherence. Additionally, numbers (%) were demonstrated for categorical indices. The χ2 test and independent sample t test were applied for comparing variables between case and control groups, respectively. We used the multivariate analysis of variance (MANOVA) test to compare dietary consumptions between case and control as well as FQS groups. Finally, logistic regression was conducted between FQS groups and psychological scores. Additionally, multivariate linear regression was performed between each component of the score and psychological scores. All analyses were considered bilateral, and a p value of < 0.05 was considered to be significant.
RESULTS
Demographic and clinical characteristics parameters of the population
Demographic and clinical characteristics of the participants between case and control groups are presented in
Table 1. The case participants’ mean ± SD age was 60.38 ± 13.61 years of which 42.5% were female. No significant differences were found in gender, age, and diastolic blood pressure among the two groups (p > 0.05). Although, there was a significant difference in the level of education between groups (p < 0.001).
Table 1Demographic and clinical characteristics of the participants between groups
Table 1
|
Variables |
Case (n = 120) |
Control (n = 120) |
p value*
|
|
Gender |
|
|
0.512 |
|
Male |
69 (57.5) |
65 (54.2) |
|
Female |
51 (42.5) |
55 (45.8) |
|
Age (yr) |
60.38 ± 13.61 |
57.43 ± 7.71 |
0.321 |
|
Educational level |
|
|
< 0.001
|
|
High school and lower |
46 (38.4) |
20 (16.7) |
|
Diploma |
61 (50.8) |
36 (30) |
|
Bachelor and higher |
13 (10.8) |
64 (53.3) |
|
Blood pressure (mmHg) |
|
|
|
|
SBP |
131.48 ± 22.09 |
121.23 ± 18.32 |
< 0.001
|
|
DBP |
79.27 ± 14.25 |
77.62 ± 12.84 |
0.312 |
|
Psychological function |
|
|
0.001
|
|
Depression |
|
|
|
|
No depression |
52 (43.3) |
78 (65.0) |
|
|
Some degree of depression |
68 (56.7) |
42 (35.0) |
|
Anxiety |
|
|
< 0.001
|
|
No anxiety |
0 (0) |
52 (43.4) |
|
Some degree of anxiety |
120 (100) |
68 (56.6) |
|
Stress |
|
|
0.003
|
|
No stress |
69 (57.5) |
49 (40.8) |
|
Some degree of stress |
51 (42.5) |
71 (59.2) |
|
Insomnia |
|
|
< 0.001
|
|
No insomnia |
88 (73.3) |
66 (55.0) |
|
Mild to severe insomnia |
32 (26.6) |
54 (45.0) |
|
Sleep quality |
|
|
< 0.001
|
|
Good sleep quality |
23 (19.2) |
30 (25.0) |
|
Poor sleep quality |
97 (80.8) |
90 (75.0) |
Relation of participants’ diets between groups
Participants in each group were divided into two groups according to their food quality score: FQS less than or equal to 27 and FQS more than 27.
Table 2 shows the evaluation of participants’ dietary nutrient intake between case and control groups as well as their food quality score components. There was a significant association between energy-adjusted dietary intakes including macronutrients (carbohydrate and fat) and several components of FQS (legumes, nuts, whole grain, coffee, dessert and ice cream, potato, potato chips) between case and control groups (p < 0.05). Moreover, no significant differences were found among the two groups of study and energy-adjusted dietary intake of some of the components of FQS including fruits, vegetables, refined grains, processed and red meats, yogurt and sugary beverage and fried food from outside the home (p > 0.05).
Table 2Energy-adjusted of dietary intakes between FQS groups
Table 2
|
Variables |
Case (n = 120) |
Control (n = 120) |
p value†
|
|
FQS ≤ 27 (n = 55) |
FQS > 27 (n = 65) |
FQS ≤ 27 (n = 59) |
FQS > 27 (n = 61) |
|
Dietary macronutrient intake‡
|
|
|
|
|
|
|
Carbohydrate (g/day) |
212.20 ± 100.47 |
240.64 ± 61.60 |
247.55 ± 60.37 |
291.17 ± 78.00*
|
< 0.001
|
|
Protein (g/day) |
79.47 ± 28.28 |
77.26 ± 19.21 |
77.73 ± 12.67 |
84.68 ± 17.86 |
0.333 |
|
Fat (g/day) |
111.05 ± 40.22 |
103.83 ± 24.61 |
98.91 ± 22.90 |
80.62 ± 27.58*
|
< 0.001
|
|
Components of FQS§ (g/day)‡
|
|
|
|
|
|
|
Fruit |
246.83 (142.92–440.03) |
549.20 (258.00–765.89)**
|
270.18 (185.06–396.34) |
418.93 (230.11–560.04)*
|
0.477 |
|
Vegetable |
104.01 (57.43–203.40) |
140.42 (84.28–224.21) |
95.44 (51.63–131.63) |
127.22 (66.91–224.65)*
|
0.175 |
|
Nuts and legumes |
10.90 (2.40–20.13) |
21.15 (12.42–39.97)*
|
22.61 (15.62–36.68) |
35.98 (15.89–56.21)**
|
< 0.001
|
|
Whole grains |
52.15 (14.68–113.57) |
113.05 (76.87–177.6845) |
122.84 (66.44–184.65) |
209.12 (118.37–347.66) |
< 0.001
|
|
Yogurt |
31.20 (3.03–64.30) |
51.81 (20.94–67.98) |
25.14 (7.24–46.36) |
43.93 (14.32–73.33) |
0.251 |
|
Coffee |
1.66 (0.83–4.18) |
1.54 (0.03–3.38) |
1.73 (0.36–7.40) |
2.13 (0.97–35.07) |
0.033
|
|
Refined grains |
145.76 ± 78.66 |
94.83 ± 69.72*
|
160.34 ± 90.62 |
111.10 ± 105.99*
|
0.228 |
|
Red meat |
43.46 (923.44–79.88) |
26.07 (15.11–42.68)*
|
52.10 (36.84–73.78) |
32.15 (18.15–51.60)*
|
0.962 |
|
Processed meat |
0.55 (0.39–0.81) |
0.52 (0.39–0.62) |
0.38 (0.29–1.38) |
0.45 (0.35–0.61) |
0.372 |
|
Desserts and ice cream |
3.86 (3.70–9.75) |
2.21 (2.07–4.77) |
13.21 (5.96–24.31) |
2.90 (1.14–7.37)*
|
0.048
|
|
Potato |
17.25 (7.87–27.82) |
20.15 (6.33–33.24) |
10.16 (3.00–16.05) |
4.23 (1.37–12.99) |
< 0.001
|
|
Potato chips |
0.75 (0.14–2.41) |
0.58 (0.13–0.78) |
1.2 (0.19–3.89) |
0.63 (0.47–2.83) |
0.006
|
|
Sugar-sweetened beverage |
24.16 (10.59–51.55) |
16.64 (6.83–35.11) |
54.01 (29.47–99.78) |
12.24 (7.57–31.27)*
|
0.166 |
|
Fried food from outside the home |
1.18 (0.42–1.53) |
1.27 (1.01–1.50) |
0.87 (0.06–4.51) |
1.02 (0.56–1.24)*
|
0.076 |
Significant differences have been shown between two groups of FQS and fruits (p = 0.001), nuts and legumes (p = 0.005), refined grain (p = 0.006), and red meat (p = 0.024) in case subjects. According to
Table 2, no significant differences have been seen between the two groups of FQS and whole grain, yogurt, coffee, processed meat, potato, and potato chips in control participants (p > 0.05).
In our logistic regression analyses, the group who were FQS ≤ 27 in each group of study served as a reference group. Multivariable-adjusted odds ratios for psychological function across categories of FQS diet are presented in crude and adjusted models in
Table 3. In the first model, the odds ratio was adjusted for age, gender, and energy intake. More adjustments were made for education status and systolic blood pressure in model 2. Only in case subjects, we observed a significant correlation between high adherence to the FQS diet and depression, anxiety, and stress in the crude model (OR = 0.796, 95% CI = 0.661–0.958, p = 0.016; OR = 0.824, 95% CI = 0.707–0.960, p = 0.013; OR = 0.824, 95% CI = 0.709–0.956, p = 0.011, respectively) and these associations remained significant in all two adjusted models. No significant correlation was observed between high adherence to the FQS diet and psychological functions in the control group (p > 0.05).
Table 3Multiple-adjusted odds ratio and 95% confidence intervals between FQS groups
Table 3
|
Variables |
Case (n = 120) |
Control (n = 120) |
|
FQS† ≤ 27 (n = 55) |
FQS† > 27 (n = 65) |
FQS† ≤ 27 (n = 59) |
FQS† > 27 (n = 61) |
|
Depression |
|
|
|
|
|
Crude |
Ref. |
0.796 (0.661–0.958)*
|
Ref. |
0.985 (0.937–1.035) |
|
Model 1 |
Ref. |
0.800 (0.665–0.962)*
|
Ref. |
0.993 (0.944–1.045) |
|
Model 2 |
Ref. |
0.789 (0.655–0.950)*
|
Ref. |
0.993 (0.944–1.045) |
|
Anxiety |
|
|
|
|
|
Crude |
Ref. |
0.824 (0.707–0.960)*
|
Ref. |
0.966 (0.903–1.033) |
|
Model 1 |
Ref. |
0.834 (0.708–0.983)*
|
Ref. |
0.968 (0.904–1.037) |
|
Model 2 |
Ref. |
0.817 (0.688–0.969)*
|
Ref. |
0.967 (0.901–1.039) |
|
Stress |
|
|
|
|
|
Crude |
Ref. |
0.824 (0.709–0.956)*
|
Ref. |
1.011 (0.969–1.053) |
|
Model 1 |
Ref. |
0.831 (0.717–0.962)*
|
Ref. |
1.012 (0.968–1.057) |
|
Model 2 |
Ref. |
0.822 (0.709–0.953)*
|
Ref. |
1.012 (0.968–1.058) |
|
Insomnia |
|
|
|
|
|
Crude |
Ref. |
1.034 (0.939–1.139) |
Ref. |
0.943 (0.865–1.028) |
|
Model 1 |
Ref. |
1.060 (0.949–1.185) |
Ref. |
0.943 (0.864–1.029) |
|
Model 2 |
Ref. |
1.061 (0.950–1.186) |
Ref. |
0.943 (0.864–1.029) |
|
Sleep Quality |
|
|
|
|
|
Crude |
Ref. |
0.915 (0.779–1.075) |
Ref. |
0.928 (0.858–1.004) |
|
Model 1 |
Ref. |
0.876 (0.727–1.054) |
Ref. |
0.921 (0.843–1.001) |
|
Model 2 |
Ref. |
0.889 (0.731–1.082) |
Ref. |
0.916 (0.843–1.000) |
|
Quality of life |
|
|
|
|
|
Crude |
Ref. |
1.018 (0.990–1.046) |
Ref. |
1.027 (0.984–1.071) |
|
Model 1 |
Ref. |
1.018 (0.989–1.047) |
Ref. |
1.024 (0.978–1.073) |
|
Model 2 |
Ref. |
1.019 (0.989–1.050) |
Ref. |
1.025 (0.978–1.074) |
Multivariate linear regression analyses were performed to examine the association between components of FQS and psychological function (
Supplementary Tables 1 and
2). To accurately determine the association, we adjusted for age, gender, education level, and energy intake. There was a significant correlation between daily fruit consumption between recovered COVID-19 patients and depression (β = −0.253; p = 0.040;
Supplementary Table 1). However, no significant association was seen between fruit intake and anxiety, stress, sleep pattern, and quality of life in the two groups (p > 0.05). There was no significant association between vegetable intake and psychological function score in two groups (p > 0.05); However, daily intake of whole grains (β = −0.276, p = 0.022; β = −0.377, p = 0.001; β = −0.300, p = 0.013), nuts and legumes (β = −0.216, p = 0.045; β = −0.232, p = 0.042; β = −0.226, p = 0.033) indicated a reverse significant correlation with depression, anxiety, and stress, respectively only in case subjects (
Supplementary Table 1). It represented that a higher consumption of these foods was related to lower depression, anxiety and stress scores. Also, the analyses indicated a higher consumption of potatoes was correlated with poor sleep quality (β = −0.272; p = 0.37). While the association between psychological function score and daily intake of yogurts, coffee, processed or red meat, desserts and ice cream, potato chips, sugar-sweetened beverages, and fried foods from outside the home was not significant (p > 0.05). It is noteworthy that a significant positive correlation was observed between daily consumption of refined grains and depression, anxiety, and stress score (β = 0.281, p = 0.021; β = 0.249, p = 0.024; β = 0.302, p = 0.013, respectively) as well as insomnia in recovered COVID-19 patients (β = 0.293; p = 0.008).
In the control group, findings showed a positive significant relation between refined grain and anxiety (β = 3.496; p = 0.016), red meat, and stress (β = 0.805; p = 0.026). Additionally, a reverse significant association between quality of life and processed meat was seen (β = −0.040; p = 0.031;
Supplementary Table 2).
DISCUSSION
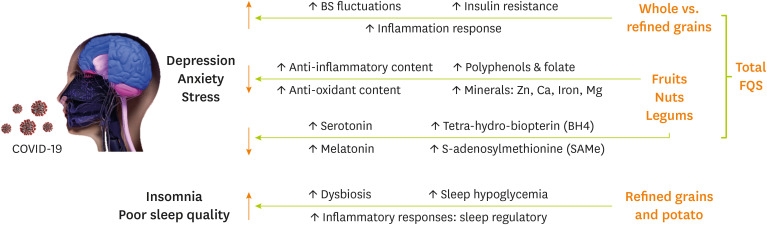
The present study was conducted to evaluate the relationship between food quality score and mental disorders such as depression, stress, anxiety, sleep quality, insomnia, and quality of life between recovered COVID-19 patients. Our findings suggest a significant reverse association between total food quality score and depression, stress, and anxiety among recovered COVID-19 patients. Furthermore, only in recovered COVID-19 subjects, a significant reverse association was observed between fruits and depression score as well as potato and sleep quality and also daily intake of nuts, legumes, and whole grains with depression, anxiety, and stress scores. Moreover, we noticed a positive significant correlation between refined grains and DASS-21 items and insomnia. Possible mechanisms regarding the association between different FQS items and psychological function between recovered COVID-19 patients are shown in
Figure 2.
Figure 2
Possible mechanisms regarding the association between different FQS items and psychological function among recovered COVID-19 patients.
FQS, food quality score; COVID-19, coronavirus disease 2019.
SARS-CoV-2 has neuroinvasive and neurovirulent properties and could penetrate the central nervous system (CNS) [
14]. There are several related mechanisms. Severe systemic inflammation which is presented by increased C-reactive protein, interleukin 6 as well as ferritin levels, cytokine-mediated neuro-inflammation, impaired intracellular signalling due to direct effects on neurons, neurodegeneration, and cerebrovascular thrombosis are possible related mechanisms. One study reported that anxiety and depression (based on hospital anxiety and depression scale) in about 29% and 11% of virology-cleared Italian COVID-19 patients. It is reported that about 15%–40% of infected patients had abnormal cognitive function in the post-infection stage [
15].
Our findings show that a higher total food quality score was significantly related to a lower risk of depression, anxiety, and stress in recovered COVID-19 patients. In line with our results, a meta-analysis mentioned that adherence to a high-quality diet resulted in a lower risk of depression [
16]. Moreover, they added that adherence to low-quality diets was not related to a higher rate of depression incidence. Also, a cross-sectional study mentioned a significant relationship between FQS and depression, anxiety, and stress in women [
4]. In addition, a better quality of life and lower depressive symptoms were seen in Korean adults and young and middle-aged Japanese women with higher diet quality [
17]. However, none of the mentioned studies was conducted among COVID-19 patients.
The correlation between the quality of diet and psychological function is complex. Although possible related mechanisms are unclear, the synergistic effects of all FQS components instead of each nutrient or group may justify the association. In this regard, anti-inflammatory, antioxidant, and neural protective effects of fruits, vegetables, nuts, and legumes, higher intake of foods rich in vitamins and minerals with protective effects on mental health, foods which are regulators of neurotransmitters like nuts or those with high caffeine content which affects dopaminergic neurotransmission and also foods which improve the link between the gut microbiome and brain function like yogurt, fruits, and whole grains, altogether, may have synergistic and supporting effects on mental health and decrease the risk of depression, anxiety and stress [
18].
In our study, we analysed each component of the food quality score built to find the exact association in detail. Our results suggested that a higher fruits, nuts, legumes, and whole grains intake as well as lower intake of refined grains resulted in lower depression, stress, and anxiety score. Our findings were consistence with other studies. A systematic review of cohort studies mentioned that fruit consumption alone or accompanied by vegetables resulted reduced risk of depression in young people and adults [
19]. Also, another study using DASS-21 to evaluate the association suggested that higher fruit and vegetable consumption are related to reduced risk of depression [
20]. Coronavirus manifestations are mainly due to systematic inflammation and oxidative stress. Also, these two may increase the risk of depression directly through their pathologic circles. It is worth mentioning that fruits, vegetables, nuts, and grains that have high amounts of antioxidants and anti-inflammatory components, polyphenols, vitamins such as folate, C, E, and B6; as well as minerals including magnesium, zinc, calcium, iron, and fiber. Also nuts have neurotransmitters’ regulating and CNS protective effects which improve cognitive function and decrease depressive symptoms [
21]. Moreover, some fruits and vegetable subgroups such as leafy green vegetables, citrus fruits as well as legumes are rich in folate. Regeneration of tetra-hydro-biopterin (BH4), remethylation of homocysteine and as a result production of S-adenosylmethionine (SAMe) is influenced by folate [
19]. Also, the production of mood regulation-related neurotransmitters such as serotonin, dopamine, and epinephrine are dependent on BH4 and SAMe [
22].
Furthermore, our results suggested that although daily consumption of whole grains is inversely associated with depression, anxiety, and stress; daily intake of refined grains showed a significant positive association with DASS-21 items. Our findings are consistence with other non-covid-19 studies [
23]. There are several mechanisms between whole and refined grains and mental complications like anxiety and depression (
Figure 2). Studies suggested that high-sensitivity C-reactive protein which is a marker of inflammation was lower when consuming higher whole grains and also higher when consuming higher refined grains [
24]. Also, a meta-analysis showed that consumption of whole grains is related to lower inflammation biomarkers like CRP and interleukin-6 but not tumor necrosis factor-α [
25]. However, results in this regard are conflicting [
26]. Moreover, high glycemic index (GI) foods like refined carbohydrates and boiled potatoes may elevate the risk of mental problems like depression. High GI foods resulted in insulin resistance, repeated acute spikes and troughs in blood glucose, postprandial hyperglycemia and as a result compensatory hyperinsulinemia. Also, insulin resistance resulted in cognitive impairment directly [
27]. Come together, whole grain consumption due to higher fiber contents and low GI in contrast to refined grains may result in reduced risk of depression, anxiety, and stress probably by decreasing inflammatory cytokines as well as prevention of hypoglycemia and insulin resistance path mechanisms.
To note, we also evaluated patients’ sleep patterns by insomnia score and PSQI score. As mentioned earlier consumption of refined grains showed a positive association with insomnia and also consumption of potatoes showed reverse association with sleep quality. Studies in this regard suggested that higher refined grains intake is correlated with increased risk of insomnia [
28]. One the of possible related mechanisms are regulatory roles of cytokines in sleep patterns (
Figure 2). Another possible mechanism is intestinal dysbiosis. High GI foods have lower fiber content. Also, sometimes sugar is added to processed foods. Altogether they resulted in a reduction of microbiota diversity and beneficial bacteria which led to impaired sleep patterns and insomnia [
28].
To note, our findings indicated a positive significant association between refined grain and anxiety, red meat, and stress as well as a reverse significant association with quality of life and processed meat among non-infected patients which emphasizes previous related studies [
29,
30]. A meta-analysis mentioned the probable relationship between intake of meat and a moderately higher risk of depression [
30]. Also, a cross-sectional study evaluating the relationship between red meat consumption and the mental health of women reported a positive significant association in this regard [
29]. To add, evaluating the correlation between consumption of whole and refined grains with psychological health showed a positive correlation between refined grains consumption and mental health among women and also a reverse relationship between intake of whole grains and anxiety. In this regard, more prospective studies with larger study sample sizes are necessary to examine the exact correlation.
Our study has many strengths. To our knowledge, it is the first case-control study regarding the association between food quality scores and mental disorders between recovered COVID-19 patients. Also, we used multi scales to evaluate different areas of psychological function such as mental health and sleep patterns. It’s worth mentioning that the most reliable tools used in this study were filled by registered trained interviewers which reduces the bias risks and proved data reliability. However; there are some limitations. Studies related to food quality and mental disorders between recovered COVID-19 patients are lacking. As a result, we were not able to compare our findings with other related assessments on the same population. In addition, we did not examine the psychological history of the individuals before COVID-19. Also, we did not consider the effect of the type and amount of oral medication. Another limitation of this study was that the FFQ is based on memory and there is a possibility of forgetting due to complications of illness and medications or mental stress. Further studies are necessary to understand the accurate relationship and possible mechanisms at different time lapses following COVID-19 infection.
It should be noted that similar patterns of association between nutrient intake and DASS-21 subscales were observed in the control group, which were not statistically significant. These findings along with the mentioned mechanisms of the pathogenesis of mental disorders in COVID-19 may indicate the role of COVID-19 as a risk factor for mental disorders compared to healthy populations. Considering the concerns about the long-term effects of COVID-19, further studies should evaluate the long-term effects of it on mental status.
CONCLUSION
It is important to notice the overall quality of the diet of recovered COVID-19 patients to achieve psychological health and improve their quality of life. Our data revealed that overall food quality intake is related to depression, anxiety, and stress symptoms during the post-infection period. Furthermore, adequate daily consumption of fruits, nuts, legumes, and whole grains in relation to psychological impairment and sleep disorders that are prevalent between recovered patients.
Mashhad University of Medical Scienceshttps://doi.org/10.13039/501100004748
981873
NOTES
-
Funding: This study is supported by Mashhad University of Medical Sciences (grant No.: 981873).
-
Conflict of Interest: The authors declare that they have no competing interests.
-
Author Contributions:
Conceptualization: Ghayour-Mobarhan M, Barghchi H.
Data curation: Zare-Feyzabadi R, Dehnavi Z, Hasanzadeh E, Esmaily H, Mohammadi Bajgiran M.
Formal analysis: Esmaily H.
Funding acquisition: Ghayour-Mobarhan M.
Investigation: Reyhaneh Ebrahimi R, Aghasizadeh M, Sadat Ekhteraee Toosi M, Hossieni R, Assaran Darban R, Asadian-Sohan P.
Project administration: Ghayour-Mobarhan M.
Writing - original draft: Araste A, Khorasanchi Z, Varasteh N, MohammadHasani K, Vahedi Fard M, Parirokh J.
Writing - review & editing: Ferns G.
ACKNOWLEDGEMENTS
We sincerely thank all patients participating in this study.
SUPPLEMENTARY MATERIALS
Supplementary Table 1
Multivariate linear regression between intakes of each component of the score built to evaluate the food quality index and psychological function score in case group
cnr-14-17-s001.xls
Supplementary Table 2
Multivariate linear regression between intakes of each component of the score built to evaluate the food quality index and psychological function score in control group
cnr-14-17-s002.xls
REFERENCES
- 1. Nalbandian A, Sehgal K, Gupta A, Madhavan MV, McGroder C, et al. Post-acute COVID-19 syndrome. Nat Med 2021;27:601-615.
- 2. Taquet M, Geddes JR, Husain M, Luciano S, Harrison PJ. 6-month neurological and psychiatric outcomes in 236 379 survivors of COVID-19: a retrospective cohort study using electronic health records. Lancet Psychiatry 2021;8:416-427.
- 3. Darooghegi Mofrad M, Siassi F, Guilani B, Bellissimo N, Suitor K, et al. The association of food quality index with mental health in women: a cross-sectional study. BMC Res Notes 2020;13:557.
- 4. Askari M, Daneshzad E, Bellissimo N, Suitor K, Dorosty-Motlagh AR, et al. Food quality score and anthropometric status among 6-year-old children: A cross-sectional study. Int J Clin Pract 2021;75:e14102.
- 5. Asadi Z, Yaghooti-Khorasani M, Ghazizadeh H, Sadabadi F, Mosa-Farkhany E, et al. Association between dietary inflammatory index and risk of cardiovascular disease in the Mashhad stroke and heart atherosclerotic disorder study population. IUBMB Life 2020;72:706-715.
- 6. Fung TT, Pan A, Hou T, Mozaffarian D, Rexrode KM, et al. Food quality score and the risk of coronary artery disease: a prospective analysis in 3 cohorts. Am J Clin Nutr 2016;104:65-72.
- 7. Henry JD, Crawford JR. The short-form version of the Depression Anxiety Stress Scales (DASS-21): construct validity and normative data in a large non-clinical sample. Br J Clin Psychol 2005;44:227-239.
- 8. Sahebi A, Asghari MJ, Salari RS. Validation of depression anxiety and stress scale (DASS-21) for an Iranian population. Journal of Iranian Psychologists 2005;1:36-54.
- 9. Morin CM, Belleville G, Bélanger L, Ivers H. The Insomnia Severity Index: psychometric indicators to detect insomnia cases and evaluate treatment response. Sleep (Basel) 2011;34:601-608.
- 10. Yazdi Z, Sadeghniiat-Haghighi K, Zohal MA, Elmizadeh K. Validity and reliability of the Iranian version of the insomnia severity index. Malays J Med Sci 2012;19:31-36.
- 11. Buysse DJ, Reynolds CF 3rd, Monk TH, Berman SR 3rd, Kupfer DJ. The Pittsburgh Sleep Quality Index: a new instrument for psychiatric practice and research. Psychiatry Res 1989;28:193-213.
- 12. Farrahi Moghaddam J, Nakhaee N, Sheibani V, Garrusi B, Amirkafi A. Reliability and validity of the Persian version of the Pittsburgh Sleep Quality Index (PSQI-P). Sleep Breath 2012;16:79-82.
- 13. Montazeri A, Goshtasebi A, Vahdaninia M, Gandek B. The Short Form Health Survey (SF-36): translation and validation study of the Iranian version. Qual Life Res 2005;14:875-882.
- 14. Rabinovitz B, Jaywant A, Fridman CB. Neuropsychological functioning in severe acute respiratory disorders caused by the coronavirus: Implications for the current COVID-19 pandemic. Clin Neuropsychol 2020;34:1453-1479.
- 15. Tomasoni D, Bai F, Castoldi R, Barbanotti D, Falcinella C, et al. Anxiety and depression symptoms after virological clearance of COVID-19: A cross-sectional study in Milan, Italy. J Med Virol 2021;93:1175-1179.
- 16. Molendijk M, Molero P, Ortuño Sánchez-Pedreño F, Van der Does W, Angel Martínez-González M. Diet quality and depression risk: A systematic review and dose-response meta-analysis of prospective studies. J Affect Disord 2018;226:346-354.
- 17. Lee JE, Kim YJ, Park HJ, Park S, Kim H, et al. Association of recommended food score with depression, anxiety, and quality of life in Korean adults: the 2014-2015 National Fitness Award Project. BMC Public Health 2019;19:956.
- 18. Grosso G, Micek A, Castellano S, Pajak A, Galvano F. Coffee, tea, caffeine and risk of depression: A systematic review and dose-response meta-analysis of observational studies. Mol Nutr Food Res 2016;60:223-234.
- 19. Dharmayani PN, Juergens M, Allman-Farinelli M, Mihrshahi S. Association between Fruit and Vegetable Consumption and Depression Symptoms in Young People and Adults Aged 15-45: A Systematic Review of Cohort Studies. Int J Environ Res Public Health 2021;18:780.
- 20. Baharzadeh E, Siassi F, Qorbani M, Koohdani F, Pak N, et al. Fruits and vegetables intake and its subgroups are related to depression: a cross-sectional study from a developing country. Ann Gen Psychiatry 2018;17:46.
- 21. Jiménez-Fernández S, Gurpegui M, Díaz-Atienza F, Pérez-Costillas L, Gerstenberg M, et al. Oxidative stress and antioxidant parameters in patients with major depressive disorder compared to healthy controls before and after antidepressant treatment: results from a meta-analysis. J Clin Psychiatry 2015;76:1658-1667.
- 22. Miller AL. The methylation, neurotransmitter, and antioxidant connections between folate and depression. Altern Med Rev 2008;13:216-226.
- 23. Gangwisch JE, Hale L, Garcia L, Malaspina D, Opler MG, et al. High glycemic index diet as a risk factor for depression: analyses from the Women’s Health Initiative. Am J Clin Nutr 2015;102:454-463.
- 24. Taskinen RE, Hantunen S, Tuomainen TP, Virtanen JK. The associations between whole grain and refined grain intakes and serum C-reactive protein. Eur J Clin Nutr 2021.
- 25. Hajihashemi P, Haghighatdoost F. Effects of Whole-Grain Consumption on Selected Biomarkers of Systematic Inflammation: A Systematic Review and Meta-analysis of Randomized Controlled Trials. J Am Coll Nutr 2019;38:275-285.
- 26. Rahmani S, Sadeghi O, Sadeghian M, Sadeghi N, Larijani B, et al. The Effect of Whole-Grain Intake on Biomarkers of Subclinical Inflammation: A Comprehensive Meta-analysis of Randomized Controlled Trials. Adv Nutr 2020;11:52-65.
- 27. McIntyre RS, Kenna HA, Nguyen HT, Law CW, Sultan F, et al. Brain volume abnormalities and neurocognitive deficits in diabetes mellitus: points of pathophysiological commonality with mood disorders? Adv Ther 2010;27:63-80.
- 28. Gangwisch JE, Hale L, St-Onge MP, Choi L, LeBlanc ES, et al. High glycemic index and glycemic load diets as risk factors for insomnia: analyses from the Women’s Health Initiative. Am J Clin Nutr 2020;111:429-439.
- 29. Darooghegi Mofrad M, Mozaffari H, Sheikhi A, Zamani B, Azadbakht L. The association of red meat consumption and mental health in women: A cross-sectional study. Complement Ther Med 2021;56:102588.
- 30. Zhang Y, Yang Y, Xie MS, Ding X, Li H, et al. Is meat consumption associated with depression? A meta-analysis of observational studies. BMC Psychiatry 2017;17:409.

 , Asie Araste1,2,*, Naeimeh Varasteh3,*, Zahra Dehnavi1


