ABSTRACT
This study evaluated the effects of replacing skipped meals with oral nutritional supplements (ONS) on the nutritional status and functional health of older adults. A total of 29 participants aged ≥ 65 years who regularly skipped at least one meal per day were included in this single-arm study. For 8 weeks, participants consumed two packs of ONS daily (150 mL each, providing 400 kcal and 18 g of protein) as a substitute for skipped meals. Nutritional status, nutrient intake, body composition, and physical function were assessed before and after the intervention. The Nutrition Quotient for the Elderly score significantly increased from 58.97 to 63.62 (p = 0.014). Total nutrient intake, including ONS, significantly improved compared with baseline (p < 0.01). Body weight and body mass index increased significantly from 58.87 to 59.47 kg (p = 0.028) and from 23.9 to 24.18 kg/m2 (p = 0.016), respectively. Calf circumference decreased significantly from 34.1 to 33.39 cm (p = 0.010). Physical function, assessed using the Short Physical Performance Battery, showed significant improvement (p = 0.003). In conclusion, replacing skipped meals with ONS may enhance nutritional status and support functional health in older adults.
-
Trial Registration
Clinical Research Information Service Identifier:
KCT0010184
-
Keywords: Aged; Dietary supplements; Malnutrition; Energy intake
INTRODUCTION
The global elderly population is increasing rapidly. In 2020, individuals aged ≥ 65 years accounted for 9.3% of the world’s population, a figure projected to increase to 16% by 2050 [
1]. In South Korea, the proportion of older adults reached 14.3% in 2018, signifying the country’s transition into an aging society. By 2025, > 20% of the population is expected to be aged ≥ 65 years, categorizing South Korea as a super-aged society [
2].
Malnutrition is one of the most common health issues affecting older adults and is closely linked to inadequate dietary intake. In this population, malnutrition can lead to chronic diseases, physical decline, and a reduced quality of life [
3]. One major contributor to malnutrition is meal skipping, defined as the intentional omission of one or more meals per day [
4]. Skipping meals disrupts regular eating patterns, reduces overall food intake and diet quality, and ultimately contributes to weight loss and poor nutritional status. These consequences, in turn, increase the risk of morbidity and mortality in older adults [
3].
Therefore, addressing irregular eating habits is essential to prevent nutritional deficiencies in older adults [
4]. Many older individuals face challenges in consuming adequate amounts of food due to age-related physiological changes, such as reduced appetite, chewing and swallowing difficulties, and declining oral health. Psychosocial factors, including social isolation and depression, further contribute to poor dietary habits and compromised nutritional status [
5]. Although overall food intake tends to decrease with age, the need for essential nutrients, such as protein and vitamins, remains unchanged. This imbalance can significantly impact the health of older adults, underscoring the importance of strategies to ensure adequate nutrient intake through nutrient-dense foods [
6].
To address these challenges, the use of oral nutritional supplements (ONS) has garnered increasing attention. ONS can effectively provide high-quality nutrition when regular meals are insufficient to meet daily nutritional requirements [
7]. Previous studies have demonstrated that ONS can improve energy intake, support weight gain, and enhance nutritional status in malnourished older adults [
8,
9]. Additionally, ONS has been shown to help prevent functional decline in frail older individuals [
10].
Although previous studies have emphasized the use of ONS as a supplement to regular meals rather than as a replacement [
8,
9,
10], limited research has explored the effects of using ONS as a substitute for skipped meals in older adults. Therefore, this study aimed to investigate changes in nutritional status and physical function in older adults who regularly skip meals when ONS is provided as a meal replacement. The findings can provide valuable insights into the potential of ONS as an effective strategy to mitigate the adverse health effects associated with meal skipping in this population.
MATERIALS AND METHODS
Study design and participants
This single-arm trial was approved by the Institutional Review Board of Kyung Hee University International Campus in September 2023 (approval number: KHGIRB-23-335) and registered with the Clinical Research Information Service (registration number:
KCT0010184). Participants were recruited from among older adults who habitually skipped at least one meal per day. Inclusion criteria were as follows: age ≥ 65 years, ability to consume food orally, ability to communicate effectively, and provision of voluntary informed consent. Exclusion criteria included the use of medications for impaired renal function, inability to walk, or current participation in an exercise or clinical nutrition program. Participants were withdrawn from the study if they 1) requested discontinuation; 2) developed a significant health problem; 3) experienced discomfort after consuming the study product; or 4) exhibited < 70% compliance with ONS intake during the 8-week intervention period.
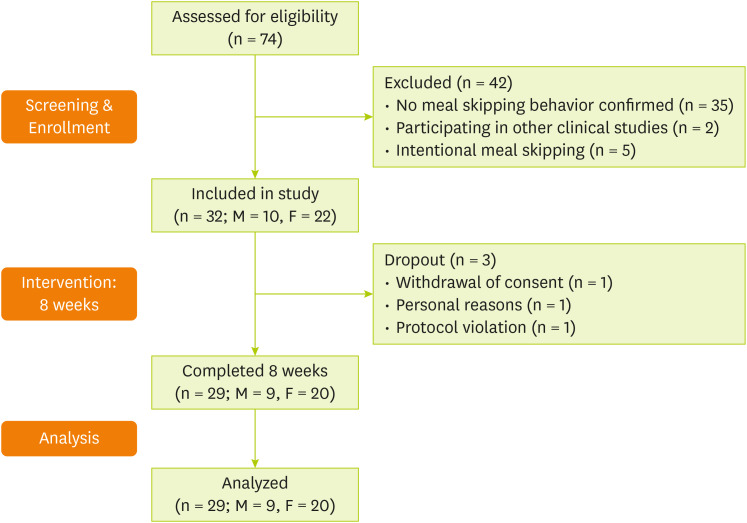
In total, 74 individuals were screened, of whom 32 met the inclusion criteria and were enrolled in the study. Among them, three participants were excluded due to withdrawal of consent (n = 1), personal reasons (n = 1), and protocol violation (poor adherence) (n = 1). Consequently, 29 participants were included in the final analysis (
Figure 1).
Figure 1
Flowchart of the study process.
M, male; F, female.
Intervention
Participants were instructed to consume an oral nutritional supplement (Miniwell OS; Korea Medical Foods Co., Ltd., Seoul, Korea) twice daily for 8 weeks, replacing their skipped meals. The supplement provided a total of 400 kcal, 18 g of protein, and various essential vitamins and minerals per day; detailed nutritional composition is presented in
Table 1. Participants received brief nutrition education on three occasions during the intervention period. To monitor adherence, they were asked to submit weekly photographs showing the remaining supplement packs, and telephone interviews were conducted to confirm compliance with the intake protocol. Throughout the study period, participants were advised to maintain their usual dietary habits and physical activity levels.
Table 1Approximate nutritional composition of Miniwell OS supplement
Table 1
|
Ingredient |
Unit |
Value per 150 mL |
|
Macronutrients |
|
|
|
Energy |
kcal |
200 |
|
Sodium |
mg |
180 |
|
Carbohydrates |
g |
29 |
|
Sugars |
g |
4.5 |
|
Fiber |
g |
2.5 |
|
Fat |
g |
6 |
|
Trans fat |
g |
0 |
|
Saturated fat |
g |
1.3 |
|
Cholesterol |
mg |
3 |
|
Protein |
g |
9 |
|
Vitamins |
|
|
|
Vitamin A |
µg RAE |
140 |
|
Vitamin B1 |
mg |
0.36 |
|
Vitamin B2 |
mg |
0.42 |
|
Vitamin B6 |
mg |
0.45 |
|
Vitamin B12 |
µg |
2.4 |
|
Vitamin C |
mg |
35 |
|
Vitamin D |
µg |
2 |
|
Vitamin E |
mg α-TE |
7.2 |
|
Vitamin K |
µg |
28 |
|
Pantothenic acid |
mg |
1 |
|
Niacin |
mg NE |
3.1 |
|
Folate |
µg DFE |
60 |
|
Biotin |
µg |
30 |
|
Minerals |
|
|
|
Calcium |
mg |
172 |
|
Phosphorus |
mg |
210 |
|
Potassium |
mg |
300 |
|
Magnesium |
mg |
30 |
|
Zinc |
mg |
2.1 |
|
Iron |
mg |
2.4 |
|
Copper |
mg |
0.2 |
|
Manganese |
mg |
0.75 |
|
Iodine |
µg |
15 |
|
Selenium |
µg |
8.25 |
|
Chromium |
µg |
4.5 |
|
Molybdenum |
µg |
3.75 |
|
Other nutrients |
|
|
|
Taurine |
mg |
17.4 |
Assessments
Sociodemographic characteristics
At baseline, participants completed a questionnaire capturing demographic information, including sex, age, household type, and income. The questionnaire also assessed dietary habits, such as meal frequency, number of meals skipped, and reasons for skipping meals.
Nutritional assessment
Nutritional status was evaluated using three methods: the Mini Nutritional Assessment (MNA), the Nutrition Quotient for the Elderly (NQ-E), and a 3-day food diary. The MNA is a validated tool designed to assess the nutritional status of older adults and consists of 18 items related to weight loss, appetite, and general health. Scores range from 0 to 30, with scores < 17 indicating malnutrition and scores between 17 and 23.5 indicating a risk of malnutrition [
11]. The NQ-E is a nutrition screening tool developed for individuals aged ≥ 65 years; it assesses dietary quality and nutritional status across domains such as balance, moderation, and dietary practices [
12]. Additionally, participants completed a 3-day food diary (2 weekdays and 1 weekend day) at baseline and at week 8. Dietary records were analyzed using CAN-Pro 6.0 software (Korean Nutrition Society, Seoul, Korea) to obtain a detailed assessment of nutrient intake.
Anthropometric measurements
All anthropometric assessments were conducted under standardized conditions, with participants in a fasting state and wearing light clothing. Body weight, body mass index (BMI), lean body mass, fat mass, and body fat percentage were measured using a bioelectrical impedance analyzer (Inbody 970; Inbody Co., Ltd., Seoul, Korea). Mid-arm circumference was measured at the midpoint between the acromion and olecranon processes, whereas calf circumference (CC) was measured at the point of greatest girth. To ensure consistency, all measurements were taken on the same side of the body at both baseline and week 8. A non-elastic measuring tape was used, placed horizontally around the measurement site without exerting pressure on the skin. Hand grip strength was assessed using a digital hand dynamometer (Jamar Plus+ Digital Hand Dynamometer; Performance Health Supply Inc., Warrenville, IL, USA). Participants were seated with their elbows flexed at 90 degrees. Three consecutive measurements were taken using the dominant hand, with a 30-second rest between trials. The average of the three measurements was used for analysis [
13].
Physical function
Physical function was assessed using the Short Physical Performance Battery (SPPB), which comprises three components: balance, gait speed, and chair-stand tests. The balance test evaluated the participant’s ability to maintain side-by-side, semi-tandem, and tandem stances for up to 10 seconds, with performance scored from 0 to 4. Gait speed was measured over a 4-m walk at a normal pace, and scoring was based on the time taken to complete the walk. The chair-stand test required participants to perform five consecutive sit-to-stand movements with arms crossed over the chest, with scoring also based on completion time. Each component was scored on a scale of 0–4, yielding a total SPPB score ranging from 0 to 12, with higher scores indicating better physical function [
14].
All statistical analyses were conducted using SPSS Statistics version 28 (IBM Corp., Armonk, NY, USA). Data are presented as mean ± standard deviation for continuous variables or as frequency and percentage for categorical variables. Within-group comparisons between baseline and post-intervention values were performed using paired t-tests for normally distributed data or Wilcoxon signed-rank tests for non-normally distributed data. A p value of < 0.05 was considered statistically significant.
RESULTS
Baseline characteristics of the participants are summarized in
Table 2. The mean age was 72.2 years, and 69% of participants were female. All participants reported consuming two meals per day, with breakfast being the most commonly skipped meal (55.2%). The most frequently cited reasons for skipping meals were loss of appetite (41.4%) and lack of time (24.1%). Based on the baseline MNA score, 58.6% of participants were classified as having normal nutritional status, whereas 41.4% were at risk of malnutrition. No participants were classified as malnourished.
Table 2 Baseline characteristics of study participants
Table 2
|
Variables |
Values |
|
Age (yr) |
72.21 ± 4.11 |
|
65–69 |
8 (27.6) |
|
70–79 |
19 (65.4) |
|
80–89 |
2 (6.9) |
|
Sex |
|
|
Male |
9 (31.0) |
|
Female |
20 (69.0) |
|
Living arrangement |
|
|
Alone |
12 (41.4) |
|
Only with spouse |
13 (44.8) |
|
Only with children |
2 (6.9) |
|
With spouse and children |
2 (6.9) |
|
Income (10,000 KRW/month) |
|
|
≥ 500 |
5 (17.2) |
|
300–500 |
3 (10.3) |
|
200–300 |
3 (10.3) |
|
100–200 |
8 (27.6) |
|
< 100 |
10 (34.5) |
|
Education |
|
|
Village school or sinology |
0 (0) |
|
Uneducated |
1 (3.4) |
|
Elementary school |
3 (10.3) |
|
Middle school |
4 (13.8) |
|
High school |
10 (34.5) |
|
College or higher |
11 (37.9) |
|
Meal frequency |
|
|
Once |
0 (0.0) |
|
Twice |
29 (100.0) |
|
Three times |
0 (0.0) |
|
Skipped meals |
|
|
Breakfast |
16 (55.2) |
|
Lunch |
6 (20.7) |
|
Dinner |
7 (24.1) |
|
Reasons for skipping meals |
|
|
Lack of appetite |
12 (41.4) |
|
Lack of time |
7 (24.1) |
|
Laziness |
5 (17.2) |
|
Difficulty in preparation |
2 (6.9) |
|
Financial constraints |
1 (3.4) |
|
Others |
2 (6.8) |
|
MNA categories |
|
|
Normal nutritional status |
17 (58.6) |
|
At risk of malnutrition |
12 (41.4) |
|
Malnourished |
0 (0.0) |
Changes in outcome variables after the 8-week intervention are presented in
Table 3. In the nutritional assessment, the total NQ-E score increased significantly (p = 0.014), with notable improvements in the subcategories of balance (p = 0.024) and moderation (p = 0.046). Although no significant change was observed in overall MNA scores, subgroup analysis revealed a significant improvement among participants who were at risk of malnutrition at baseline (p = 0.012). Anthropometric measurements showed a significant increase in body weight (p = 0.028) and BMI (p = 0.016) at week 8 compared with baseline. Conversely, CC significantly decreased during the same period (p = 0.010).
Table 3 Changes in physical and nutritional assessments from baseline to week 8
Table 3
|
Variables |
Participants (n = 29) |
Δ Change |
p value |
|
Week 0 |
Week 8 |
|
Anthropometric parameters |
|
|
|
|
|
Weight (kg) |
58.87 ± 9.90 |
59.47 ± 9.68 |
0.60 ± 1.39 |
0.028*
|
|
BMI (kg/m2) |
23.90 ± 2.53 |
24.18 ± 2.57 |
0.27 ± 0.57 |
0.016*
|
|
Muscle mass (kg) |
21.40 ± 4.46 |
21.37 ± 4.23 |
−0.02 ± 1.07 |
0.584 |
|
Body fat mass (kg) |
19.14 ± 5.09 |
19.76 ± 4.93 |
0.62 ± 1.51 |
0.077 |
|
Percent body fat (%) |
32.36 ± 6.20 |
33.12 ± 5.63 |
0.76 ± 2.77 |
0.344 |
|
MAC (cm) |
26.44 ± 2.88 |
26.49 ± 2.77 |
0.04 ± 2.48 |
0.762 |
|
CC (cm) |
34.10 ± 2.86 |
33.39 ± 2.73 |
−0.71 ± 1.60 |
0.010*
|
|
Hand grip strength (kg) |
24.46 ± 8.28 |
25.48 ± 8.13 |
1.02 ± 3.13 |
0.091 |
|
Male†
|
33.55 ± 9.08 |
35.32 ± 6.98 |
1.77 ± 4.23 |
0.244 |
|
Female‡
|
20.37 ± 3.08 |
21.05 ± 3.19 |
0.68 ± 2.54 |
0.250 |
|
Nutritional assessment |
|
|
|
|
|
MNA |
23.81 ± 2.80 |
24.48 ± 2.40 |
0.67 ± 2.14 |
0.102 |
|
Normal nutritional status§
|
25.68 ± 1.48 |
25.53 ± 1.82 |
−0.15 ± 1.78 |
0.738 |
|
At risk of malnutrition‖
|
21.17 ± 1.96 |
23.00 ± 2.39 |
1.83 ± 2.12 |
0.012*
|
|
NQ-E, Balance |
52.65 ± 17.98 |
58.38 ± 17.39 |
5.73 ± 12.88 |
0.024*
|
|
NQ-E, Moderation |
61.94 ± 31.85 |
71.65 ± 30.39 |
9.71 ± 22.62 |
0.046*
|
|
NQ-E, Practice |
68.05 ± 12.90 |
69.56 ± 12.30 |
1.51 ± 11.20 |
0.475 |
|
NQ-E, Total |
58.97 ± 14.30 |
63.62 ± 13.15 |
4.65 ± 9.50 |
0.014*
|
Table 4 presents changes in participants’ nutrient intake assessed at three time points: baseline (week 0), week 8 (excluding ONS), and week 8 including ONS (week 8 + ONS). From baseline to week 8, calcium intake significantly decreased (p = 0.026), whereas no significant changes were observed for other nutrients. However, when ONS intake was included at week 8, the intake of all assessed nutrients showed a significant increase compared with baseline (p < 0.01).
Table 4 Changes in nutrient intake from baseline to week 8
Table 4
|
Nutrient intake |
Participants (n = 29) |
p value (Δ8w-0w) |
p value (Δ8w+ONS-0w) |
|
Week 0 |
Week 8 |
Week 8 + ONS |
|
Energy (kcal) |
1,373.43 ± 355.40 |
1,376.96 ± 316.83 |
1,776.96 ± 316.83 |
0.954 |
< 0.001***
|
|
Carbohydrate (g) |
196.34 ± 50.93 |
199.97 ± 44.16 |
257.97 ± 44.16 |
0.694 |
< 0.001***
|
|
Fat (g) |
37.17 ± 14.13 |
37.25 ± 12.93 |
49.25 ± 12.93 |
0.976 |
< 0.001***
|
|
Protein (g) |
58.50 ± 20.44 |
56.97 ± 16.87 |
74.97 ± 16.87 |
0.654 |
< 0.001***
|
|
Vitamin A (µg RAE) |
415.76 ± 305.31 |
339.06 ± 196.79 |
619.06 ± 196.79 |
0.284 |
< 0.001***
|
|
Vitamin B1 (mg) |
1.00 ± 0.34 |
0.90 ± 0.28 |
1.62 ± 0.28 |
0.161 |
< 0.001***
|
|
Vitamin B2 (mg) |
1.14 ± 0.31 |
1.04 ± 0.35 |
1.88 ± 0.35 |
0.143 |
< 0.001***
|
|
Vitamin B6 (mg) |
0.42 ± 0.38 |
0.38 ± 0.26 |
1.28 ± 0.26 |
0.601 |
< 0.001***
|
|
Vitamin B12 (µg) |
2.89 ± 2.37 |
2.91 ± 2.14 |
7.71 ± 2.14 |
0.658 |
< 0.001***
|
|
Vitamin D (µg) |
1.25 ± 1.25 |
1.31 ± 1.25 |
5.31 ± 1.25 |
0.821 |
< 0.001***
|
|
Vitamin E (mg α-TE) |
3.74 ± 1.23 |
3.63 ± 1.37 |
18.03 ± 1.37 |
0.721 |
< 0.001***
|
|
Vitamin C (mg) |
71.83 ± 41.17 |
60.92 ± 44.85 |
130.92 ± 44.85 |
0.192 |
< 0.001***
|
|
Niacin (mg NE) |
8.63 ± 2.33 |
8.33 ± 2.94 |
14.53 ± 2.94 |
0.604 |
< 0.001***
|
|
Folate (µg DFE) |
245.84 ± 75.01 |
220.28 ± 84.61 |
340.28 ± 84.61 |
0.107 |
< 0.001***
|
|
Calcium (mg) |
450.80 ± 169.41 |
375.56 ± 171.72 |
719.56 ± 171.72 |
0.026*
|
< 0.001***
|
|
Potassium (mg) |
2,158.92 ± 599.40 |
2,116.73 ± 680.94 |
2,716.73 ± 680.94 |
0.746 |
< 0.001***
|
|
Magnesium (mg) |
210.55 ± 61.48 |
191.22 ± 77.97 |
251.22 ± 77.97 |
0.180 |
0.007**
|
|
Iron (mg) |
10.64 ± 3.91 |
9.57 ± 3.92 |
14.37 ± 3.92 |
0.273 |
< 0.001***
|
|
Zinc (mg) |
6.12 ± 1.93 |
6.14 ± 2.32 |
10.34 ± 2.32 |
0.972 |
< 0.001***
|
|
Selenium (µg) |
55.99 ± 21.66 |
55.72 ± 18.35 |
72.22 ± 18.35 |
0.958 |
0.003**
|
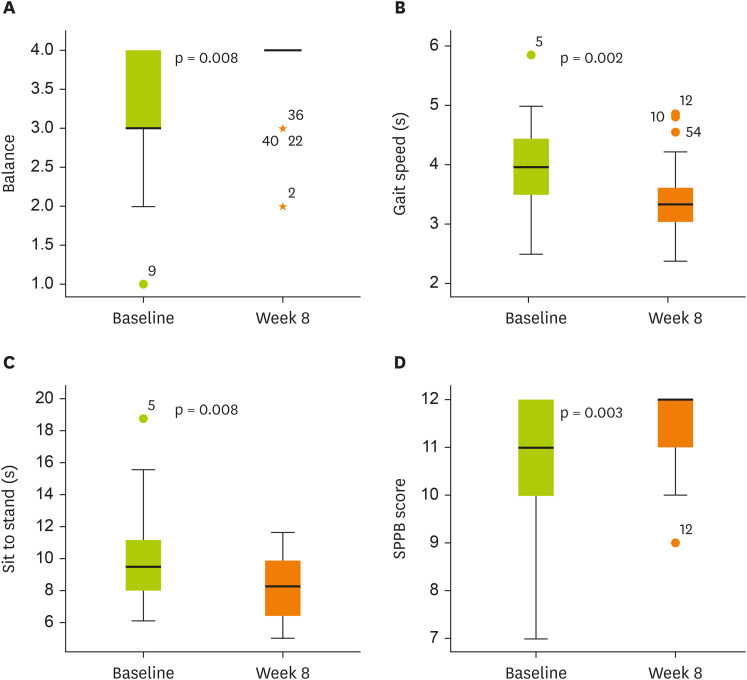
The total SPPB score improved significantly following the intervention compared with baseline, with all 3 components—balance test, gait speed, and chair-stand test—showing significant improvements (
Figure 2). Additionally, the average compliance rate with the ONS intervention was 98%.
Figure 2
Changes in SPPB scores from baseline to week 8.
(A) Balance: 3.31 ± 0.81 to 3.76 ± 0.51 (Δ 0.45 ± 0.78, p = 0.008). (B) Gait speed: 3.96 ± 0.78 to 3.41 ± 0.61 (Δ −0.56 ± 0.88, p = 0.002). (C) Sit to stand: 9.83 ± 2.82 to 8.32 ± 1.85 (Δ −1.51 ± 2.96, p = 0.008). (D) SPPB score: 10.83 ± 1.28 to 11.62 ± 0.73 (Δ 0.79 ± 1.32, p = 0.003).
Box plots show median (line inside the box), interquartile range (box), and minimum and maximum values (whiskers).
SPPB, Short Physical Performance Battery.

DISCUSSION
This study investigated the effects of an 8-week ONS intervention on the nutritional status and functional health of older adults who used ONS as a replacement for skipped meals. The findings demonstrated significant improvements in the NQ-E score. Additionally, both body weight and BMI increased significantly over the intervention period. Conversely, CC decreased significantly. Notably, physical function, as assessed using the SPPB, also improved significantly.
This study documented significant improvements in participants’ total NQ-E scores, particularly in the domains of balance and moderation. These findings suggest that the provision of ONS, along with minimal nutrition education, may positively influence the dietary habits of older adults who regularly skip meals. The observed improvement in the balance domain indicates increased consumption of a more nutritionally diverse diet, incorporating a wider variety of food groups. Simultaneously, improvements in the moderation domain reflect reduced intake of sugary beverages, confectionery, fatty breads, and snack foods, contributing to overall dietary quality [
12]. Collectively, these results support the potential of ONS as an effective intervention for promoting balanced nutrition and enhancing diet quality in older adults with irregular eating patterns, thereby contributing to improved nutritional status and overall health.
Participants in this study typically consumed only two meals per day, with “lack of appetite” being the most frequently reported reason for meal omission. This may be attributed to anorexia of aging, a condition characterized by a gradual decline in appetite and food intake with advancing age [
15]. Anorexia of aging not only reduces total caloric intake but also alters dietary patterns by limiting the consumption of specific food groups [
16]. According to the Korea National Health and Nutrition Examination Survey, older adults in South Korea generally have insufficient energy intake, with particularly low consumption of key micronutrients such as calcium, potassium, riboflavin, and vitamin A [
17]. These deficiencies can significantly compromise nutritional status, highlighting the need for targeted interventions to address appetite loss and nutrient insufficiency [
16]. Although a previous study suggested that ONS intake suppresses appetite and reduces food consumption [
18], a meta-analysis reported opposing findings, showing that ONS can enhance appetite and increase the intake of energy, protein, and fat in older adults [
19]. Consistent with these findings, the present study showed that ONS supplementation improved the intake of several key micronutrients, such as vitamins E and C, B vitamins, and trace minerals including iron and zinc, bringing them in line with the recommended levels established by the Korean Dietary Reference Intakes [
20]. However, calcium intake from conventional food sources (excluding ONS) significantly declined at week 8 compared with baseline, possibly due to a reduction in milk consumption as participants adjusted their diets to include ONS. Despite this, the overall nutrient intake improved, suggesting that ONS does not suppress appetite but rather acts as a comprehensive nutritional intervention, effectively compensating for deficiencies associated with skipped meals.
A previous study suggested that compared with younger individuals, older adults experience prolonged satiety when consuming ONS alongside regular meals, a phenomenon likely attributable to age-related differences in satiety regulation mechanisms [
21]. Satiety is closely associated with physiological processes that govern meal termination and appetite satisfaction, highlighting the importance of carefully timing ONS supplementation [
22]. In the present study, ONS was consumed as a substitute for skipped meals rather than as an addition to regular meals, which likely minimized its potential to interfere with subsequent food consumption. These findings indicate that ONS may serve as an effective strategy to meet the comprehensive nutritional needs of older adults while also addressing irregular eating patterns and compensating for skipped meals.
Body weight is a critical indicator of nutritional status in geriatric populations, with weight loss and declining BMI recognized as early markers of malnutrition [
23]. In this study, the significant increases observed in both body weight and BMI are consistent with previous findings demonstrating the positive effects of ONS on body composition among malnourished older adults [
8,
9]. Conversely, studies involving nutritionally adequate older adults have reported stable BMI values following ONS supplementation [
24]. These findings suggest that the current intervention effectively increased caloric intake and contributed to weight gain among older adults with meal-skipping behaviors. Collectively, these results underscore the clinical utility of ONS as a preventive strategy against malnutrition in at-risk older populations.
Despite significant increases in body weight and BMI, this study observed a reduction in CC. CC is commonly used as an anthropometric proxy for muscle mass, with a previous study demonstrating strong correlations between CC and both appendicular skeletal muscle mass and skeletal muscle index measured via dual-energy X-ray absorptiometry [
25]. These findings support its use as an indirect indicator of muscle mass. However, in the present study, muscle mass was preserved despite the decline in CC, indicating that a reduction in CC may not uniformly reflect muscle loss across all contexts. Moreover, another study reported significant increases in both mid-upper arm circumference and CC following longer-term interventions (e.g., 90 days) [
26], whereas the relatively short duration of the present study (8 weeks) may have been insufficient to elicit measurable structural changes in peripheral musculature. The slight decrease in CC, despite stable muscle mass, may reflect the complex relationship between muscle quantity and circumferential measurements or may indicate that observable structural changes require longer intervention periods. Therefore, extended-duration studies are warranted to comprehensively assess circumferential changes in the extremities.
Although muscle mass was maintained following the 8-week ONS intervention, participants exhibited significant improvements in physical function, as indicated by increased SPPB scores. These findings align with those of a previous study involving frail older adults that demonstrated functional improvements after 24 weeks of protein supplementation, even in the absence of measurable gains in skeletal muscle mass [
27]. The SPPB is a widely used and validated tool for assessing lower extremity function, and its scores are recognized as important predictors of mortality, nursing home admission, and future disability in older adults [
14,
28]. The observed improvement in physical function without a corresponding increase in muscle mass indicates that muscle quantity alone may not be the primary determinant of functional gains. Instead, neuromuscular adaptations and qualitative attributes of muscle, such as coordination, fiber type composition, and metabolic efficiency, may play a more pivotal role in enhancing functional capacity. These findings are consistent with those of a previous study showing that declines in muscle strength in older adults are not fully explained by reductions in muscle mass, underscoring the importance of muscle quality in functional performance [
29].
Notably, the mean baseline SPPB score of 10.83 in this study closely aligns with the average score of 10.8 reported for community-dwelling older adults in the Korean Frailty and Aging Cohort Study [
30]. This similarity indicates that ONS may improve physical function not only in frail individuals but also in relatively healthy, high-functioning older adults. These findings highlight the broader potential of ONS as a preventive nutritional strategy for maintaining functional health in community-dwelling older populations. Conversely, handgrip strength, a key indicator of overall muscle strength, remained unchanged throughout the study. This is consistent with findings from previous meta-analyses, which reported no significant effect of ONS alone on grip strength in older adults [
31]. However, it has been shown that combining protein supplementation with resistance exercise can significantly improve both muscle mass and grip strength [
32]. Therefore, future studies may benefit from incorporating exercise components alongside ONS to optimize functional and musculoskeletal outcomes.
This study has certain important limitations. First, it was conducted as a single-arm trial without a control group, which limits the generalizability of our findings. Although participants had varying nutritional statuses, all received the nutritional intervention due to a presumed high risk of frailty, making it challenging to compare outcomes against a non-intervention group. Second, potential measurement errors in anthropometric assessments may have influenced the accuracy of our results. Despite adherence to standardized protocols, minor variations in participant posture, tape tension, or measurement site positioning may have occurred during baseline and follow-up evaluations. These methodological limitations could partially account for the discrepancy observed between the preservation of muscle mass and the reduction in CC.
Despite these limitations, the study presents a notable strength: an exceptionally high adherence rate to the ONS intervention. Participants demonstrated a 98% adherence rate, substantially exceeding the average adherence rate of 81% reported in a previous study involving community-dwelling older adults [
33]. This high level of compliance is likely attributable to the study design, which allowed participants to voluntarily consume ONS as a replacement for their skipped meals, an approach that may have enhanced motivation and acceptability. Given the well-established association between adherence and clinical outcomes [
33], the high adherence observed in this study likely contributed to the significant improvements in body weight and SPPB scores. These findings underscore the critical role of adherence in maximizing the effectiveness of ONS interventions. Furthermore, the intervention model, which was tailored to reflect the real-life eating behaviors of older adults who skip meals, provides valuable insights into the practical application of ONS in both public health and clinical settings.
CONCLUSION
This study demonstrated that providing ONS as a replacement for skipped meals over an 8-week period improved the nutritional status and functional health of older adults with meal-skipping behaviors. These findings indicate that ONS may serve as an effective strategy to reduce the risk of malnutrition in this population.
Ministry of Trade, Industry and Energyhttps://doi.org/10.13039/501100003052
P00014276
NOTES
-
Funding: This study was supported by a grant from the Korea Institute for Advancement of Technology (KIAT), funded by the Ministry of Trade, Industry and Energy (MOTIE), Republic of Korea (Grant Number: P00014276, Industry Innovation Foundation Building Program).
-
Conflict of Interest: Choi S and Han E are employed by Korea Medical Foods and were involved in the delivery of the oral nutritional supplement used in this study. The other authors declare no conflicts of interest. This study received product support from Korea Medical Foods; however, the company had no role in the study design, data collection and analysis, manuscript preparation, or the decision to submit the article for publication.
-
Author Contributions:
Conceptualization:Lee J, Shin H, Park YK.
Data curation:Lee J, Cho SA.
Formal analysis:Lee J.
Funding acquisition:Shin H.
Resources:Choi S, Han E.
Investigation:Lee J, Cho SA.
Methodology:Lee J, Park YK.
Supervision:Shin H, Park YK.
Writing - original draft:Lee J, Cho SA.
Writing - review & editing:Choi S, Han E, Shin H, Park YK.
ACKNOWLEDGEMENTS
We thank “Korea Medical Foods” for the research support and product (Miniwell) supply.
REFERENCES
- 1. United Nations Department of Economic and Social Affairs Population Division. World population aging 2020 highlights. 2020. cited 2024 December 12. Available from https://www.un.org/development/desa/pd/sites/www.un.org.development.desa.pd/files/files/documents/2020/Sep/un_pop_2020_pf_ageing_10_key_messages.pdf
- 2. Korean National Statistical Office. Population projection. 2023. cited 2024 December 12. Available from https://kosis.kr/statHtml/statHtml.do?orgId=101&tblId=DT_1BPA003&conn_path=I2
- 3. Chen CC, Schilling LS, Lyder CH. A concept analysis of malnutrition in the elderly. J Adv Nurs 2001;36:131-142.
- 4. Quandt SA, Arcury TA, Bell RA, McDonald J, Vitolins MZ, et al. Meal patterns of older adults in rural communities: life course analysis and implications for undernutrition. J Appl Gerontol 1997;16:152-171.
- 5. Rémond D, Shahar DR, Gille D, Pinto P, Kachal J, et al. Understanding the gastrointestinal tract of the elderly to develop dietary solutions that prevent malnutrition. Oncotarget 2015;6:13858-13898.
- 6. Brownie S. Older Australians’ views about the impact of ageing on their nutritional practices: findings from a qualitative study. Australas J Ageing 2013;32:86-90.
- 7. Volkert D, Beck AM, Cederholm T, Cruz-Jentoft A, Goisser S, et al. ESPEN guideline on clinical nutrition and hydration in geriatrics. Clin Nutr 2019;38:10-47.
- 8. Payette H, Boutier V, Coulombe C, Gray-Donald K. Benefits of nutritional supplementation in free-living, frail, undernourished elderly people: a prospective randomized community trial. J Am Diet Assoc 2002;102:1088-1095.
- 9. Wouters-Wesseling W, Van Hooijdonk C, Wagenaar L, Bindels J, de Groot L, et al. The effect of a liquid nutrition supplement on body composition and physical functioning in elderly people. Clin Nutr 2003;22:371-377.
- 10. Kim CO, Lee KR. Preventive effect of protein-energy supplementation on the functional decline of frail older adults with low socioeconomic status: a community-based randomized controlled study. J Gerontol A Biol Sci Med Sci 2013;68:309-316.
- 11. Vellas B, Villars H, Abellan G, Soto ME, Rolland Y, et al. Overview of the MNA--Its history and challenges. J Nutr Health Aging 2006;10:456-463. discussion 463-455.
- 12. Lim YS, Lee JS, Hwang JY, Kim KN, Hwang HJ, et al. Revision of nutrition quotient for elderly in assessment of dietary quality and behavior. J Nutr Health 2022;55:155-173.
- 13. Mathiowetz V, Weber K, Volland G, Kashman N. Reliability and validity of grip and pinch strength evaluations. J Hand Surg Am 1984;9:222-226.
- 14. Guralnik JM, Simonsick EM, Ferrucci L, Glynn RJ, Berkman LF, et al. A short physical performance battery assessing lower extremity function: association with self-reported disability and prediction of mortality and nursing home admission. J Gerontol 1994;49:M85-M94.
- 15. Morley JE, Silver AJ. Anorexia in the elderly. Neurobiol Aging 1988;9:9-16.
- 16. Donini LM, Poggiogalle E, Piredda M, Pinto A, Barbagallo M, et al. Anorexia and eating patterns in the elderly. PLoS One 2013;8:e63539.
- 17. Han G, Yang E. Evaluation of dietary habit and nutritional intake of Korean elderly: data from Korea National Health and Nutrition Examination Survey 2013–2015. J East Asian Soc Diet Life 2018;28:258-271.
- 18. Lauque S, Arnaud-Battandier F, Mansourian R, Guigoz Y, Paintin M, et al. Protein-energy oral supplementation in malnourished nursing-home residents. A controlled trial. Age Ageing 2000;29:51-56.
- 19. Li M, Zhao S, Wu S, Yang X, Feng H. Effectiveness of oral nutritional supplements on older people with anorexia: a systematic review and meta-analysis of randomized controlled trials. Nutrients 2021;13:835.
- 20. Ministry of Health and Welfare. The Korean Nutrition Society. Dietary reference intakes for Koreans 2020. Sejong: Ministry of Health and Welfare; 2020.
- 21. Wilson MMG, Purushothaman R, Morley JE. Effect of liquid dietary supplements on energy intake in the elderly. Am J Clin Nutr 2002;75:944-947.
- 22. Benelam B. Satiation, satiety and their effects on eating behaviour. Nutr Bull 2009;34:126-173.
- 23. Kondrup J, Allison SP, Elia M, Vellas B, Plauth M. Educational and Clinical Practice Committee, European Society of Parenteral and Enteral Nutrition (ESPEN). ESPEN guidelines for nutrition screening 2002. Clin Nutr 2003;22:415-421.
- 24. Krondl M, Coleman PH, Bradley CL, Lau D, Ryan N. Subjectively healthy elderly consuming a liquid nutrition supplement maintained body mass index and improved some nutritional parameters and perceived well-being. J Am Diet Assoc 1999;99:1542-1548.
- 25. Kawakami R, Murakami H, Sanada K, Tanaka N, Sawada SS, et al. Calf circumference as a surrogate marker of muscle mass for diagnosing sarcopenia in Japanese men and women. Geriatr Gerontol Int 2015;15:969-976.
- 26. Chew STH, Tan NC, Cheong M, Oliver J, Baggs G, et al. Impact of specialized oral nutritional supplement on clinical, nutritional, and functional outcomes: a randomized, placebo-controlled trial in community-dwelling older adults at risk of malnutrition. Clin Nutr 2021;40:1879-1892.
- 27. Tieland M, van de Rest O, Dirks ML, van der Zwaluw N, Mensink M, et al. Protein supplementation improves physical performance in frail elderly people: a randomized, double-blind, placebo-controlled trial. J Am Med Dir Assoc 2012;13:720-726.
- 28. Guralnik JM, Ferrucci L, Simonsick EM, Salive ME, Wallace RB. Lower-extremity function in persons over the age of 70 years as a predictor of subsequent disability. N Engl J Med 1995;332:556-561.
- 29. Goodpaster BH, Park SW, Harris TB, Kritchevsky SB, Nevitt M, et al. The loss of skeletal muscle strength, mass, and quality in older adults: the health, aging and body composition study. J Gerontol A Biol Sci Med Sci 2006;61:1059-1064.
- 30. Jung HW, Kim S, Jang IY, Shin DW, Lee JE, et al. Screening value of timed up and go test for frailty and low physical performance in Korean older population: the Korean Frailty and Aging Cohort Study (KFACS). Ann Geriatr Med Res 2020;24:259-266.
- 31. van Zwienen-Pot JI, Reinders I, de Groot LCPG, Beck AM, Feldblum I, et al. Effects of nutritional interventions in older adults with malnutrition or at risk of malnutrition on muscle strength and mortality: results of pooled analyses of individual participant data from nine RCTs. Nutrients 2023;15:2025.
- 32. Hou L, Lei Y, Li X, Huo C, Jia X, et al. Effect of protein supplementation combined with resistance training on muscle mass, strength and function in the elderly: a systematic review and meta-analysis. J Nutr Health Aging 2019;23:451-458.
- 33. Hubbard GP, Elia M, Holdoway A, Stratton RJ. A systematic review of compliance to oral nutritional supplements. Clin Nutr 2012;31:293-312.