ABSTRACT
Cataracts are a major cause of vision impairment in older adults and pose a growing concern in aging societies. This study examined the association between dietary macronutrient intake and the odds of having cataracts among 1,619 Korean adults aged ≥ 60 years using data from the 2015–2017 Korea National Health and Nutrition Examination Survey. Cataracts were present in 51.8% of participants. Dietary intake was assessed via 24-hour recall and macronutrient intake was categorized by quartiles and energy ratios. After adjusting for covariates, individuals in the highest quartile of carbohydrate-to-energy intake (> 80%) had 41% higher odds of having cataracts (odds ratio [OR], 1.41; 95% confidence interval [CI], 0.99–2.01), with a significant trend (p for trend = 0.022). In contrast, the highest quartile of protein intake (Q3: 12%–15% energy) was associated with significantly lower odds of having cataracts in women (OR, 0.59; 95% CI, 0.40–0.88). Likewise, fat intake exceeding 18% of total energy was associated with reduced odds of having cataracts (OR, 0.69; 95% CI, 0.49–0.97). Saturated and monounsaturated fat intake also showed inverse associations with the odds of having cataracts. These results suggest that excessive carbohydrate intake, particularly when replacing fats and proteins, may increase the odds of having cataracts in older adults, especially among women. Dietary adjustments aimed at reducing the proportion of carbohydrates and increasing high-quality protein and fat intake may help prevent cataracts in aging populations. Further longitudinal studies are needed to clarify causal relationships and to inform nutritional guideline development.
-
Keywords: Cataracts; Macronutrients; Dietary pattern; Aged; Nutrition surveys
INTRODUCTION
Visual impairment is prevalent among the elderly, with cataract being a leading cause of blindness [
1]. Cataract, a widespread degenerative eye condition in older adults, can cause vision loss due to clouding of the eye’s transparent lens and may lead to blindness in severe cases [
2].
The World Health Organization (WHO) reports that cataracts contribute to 42% of visual impairment worldwide and 39% in the Asian population, including Koreans. Additionally, cataracts account for 50% of eye diseases diagnosed among the elderly [
2]. National Institutes of Health (NIH) survey data have revealed a gradual increase in cataract prevalence from the age of 40, with 70% of Americans over 80 affected [
3]. According to the National Health Insurance Corporation’s ‘2021 Major Surgical Statistics,’ cataract surgeries have increased by an average of 9% per year [
4]. The aging population trend suggests a continued increase in cataract prevalence.
Cataracts are associated with various chronic conditions, including age, sex, ultraviolet exposure, alcohol consumption, smoking, body mass index (BMI), high blood pressure, and diabetes. Dietary factors can also significantly influence cataract development [
5,
6,
7,
8].
According to the 6th phase of the Korea National Health and Nutrition Survey, a significant portion of the elderly, specifically 54.6% of men and 58.1% of women aged 65 to 74 years and over 70% of those aged 75 years or more, consumed less energy than the estimated requirement [
9]. Soh et al. [
10] have found that carbohydrate intake constitutes over 75% of the total diet and that this percentage is increased with age, particularly in those aged 50 to 64 years. Han et al. [
9] have indicated a significant increase of insufficient protein intake from 21.7% in 2010 to 27.0% in 2019, with the highest inadequacy observed in those aged 65 years or more. A high carbohydrate and low-fat ratio can lead to cataract development due to protein damage and accumulation in the lens [
6,
11].
Supporting these findings, the Melbourne Visual Impairment Project involving 3,217 participants reported that non-diabetic individuals who consumed more than 181 g of carbohydrates per day had approximately three times higher odds of having cortical cataracts compared to those with the lowest carbohydrate intake [
1]. Similarly, the Blue Mountain study involving 4,888 subjects found that individuals who consumed 99 g of protein daily had approximately 50% lower odds of having nuclear cataracts, suggesting that a higher protein intake may be associated with a lower prevalence of nuclear cataracts [
1]. However, the same study [
12] also observed an 8% reduction in the prevalence of cortical cataracts among participants who consumed more than 30.6 g of highly unsaturated fat per day. Conversely, Lu et al. [
13] have reported a 2.3-fold increase in the odds of having nuclear cataracts with higher fat intake.
As of 2024, Korean has entered an aged society, with the elderly population accounting for 19.5% of the total population [
14]. With the growth of this demographic, understanding the impact of diet on health has become increasingly important. However, there is limited research on the relationship between macronutrients and cataracts. This study aimed to analyze dietary habits of the elderly in Korea using data (focusing on nutrient intake) from the 6th and 7th National Health and Nutrition Surveys (2015–2017) to establish a foundational understanding of this relationship and its implications for the quality of life of the elderly.
MATERIALS AND METHODS
Data source and study population
Population data used for this study were obtained from the Korea National Health and Nutrition Examination Survey (KNHANES), a nationally representative survey conducted in South Korea. This study utilized health interview data, physical examination, and 24-hour dietary intake recall data from a sample of 23,657 individuals. These participants were part of the 6th (2015) and 7th (2016–2017) years of the National Health and Nutrition Survey, which were designed as cross-sectional studies. The primary objective was to analyze the relationship between dietary intake and the prevalence of cataracts among Koreans aged 60 years or older.
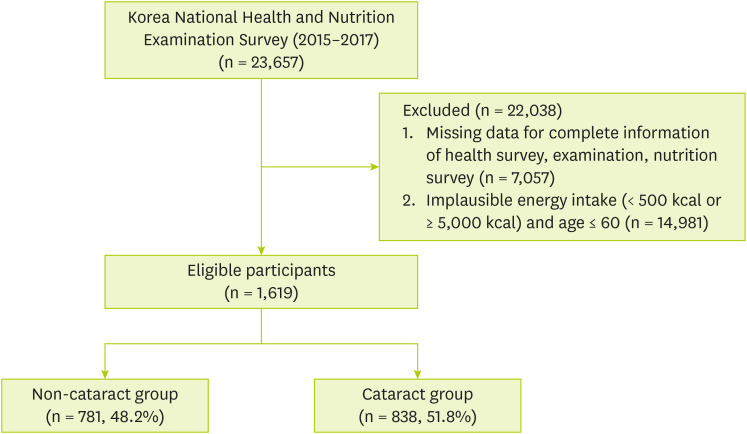
An analysis of the age distribution of cataract prevalence in this study showed the highest proportion among individuals aged 60 and older; therefore, participants aged 60 and above were selected for the study. After excluding 7,057 individuals due to missing data and 14,981 individuals who either reported implausible energy intake (< 500 kcal or ≥ 5,000 kcal) and were aged 60 years or younger, a total of 1,619 subjects were included in the final analysis (781 in the non-cataract group and 838 in the cataract group) (
Figure 1).
Figure 1Flow diagram showing the selection of study participants.
General characteristics
In this study, variables were selected and reclassified based on their relevance to cataracts and characteristics of the data. Following previous studies [
15,
16], the data were divided into quartiles to ensure an equal distribution of samples. Analyzed factors included sex, age, household income level, education level, BMI, smoking status, drinking habits, and blood pressure as assessed in health interviews and examination surveys.
Sex was categorized as men or women, and age was classified into three groups: 60–69 years, 70–79 years, and 80 years or older. Income level was classified into four household income quartiles: high, upper-middle, lower-middle, and low. Educational level was categorized as college or higher, high school, middle school, and elementary school or below. Smoking status was classified into three categories: non-smoker, former smoker, and current smoker. Drinking habits were similarly categorized based on the frequency of alcohol consumption over the past year: non-drinker or infrequent drinker, 1–4 times per month, and 2–4 times per week. BMI was categorized according to the Obesity Treatment Guidelines [
17] as follows: underweight (BMI: < 18.5 kg/m
2), normal weight (BMI: 18.5–22.9 kg/m
2), pre-obesity (BMI: 23–24.9 kg/m
2), and obesity (BMI > 25 kg/m
2). Hypertension was defined as having a final systolic blood pressure ≥ 140 mmHg, a final diastolic blood pressure ≥ 90 mmHg, or the use of antihypertensive medication.
Nutrient intake was assessed based on the “type and amount of food” consumed, as recorded using a 24-hour dietary recall method. This assessment involved the use of volume/weight conversion databases, food ingredient databases for each food item, and nutrient component databases for each nutrient. The focus of the analysis was on the intake of energy, carbohydrates, protein, and fat.
Statistical analysis
The Korea National Health and Nutrition Survey uses a two-stage stratified cluster sampling design for its sample structure. Statistical analysis was conducted using a complex sample analysis approach, incorporating weights to accurately represent the entire population. For the analysis of combined data, the cluster variable (primary extraction unit) was calculated by adjusting the existing weight in proportion to the number of survey groups per year.
All data analyses were performed using the SPSS software version 20.0 (IBM Corp., Armonk, NY, USA). The threshold for statistical significance was set at p < 0.05. Data are presented as means ± standard deviation, frequencies, and percentages. Chi-square tests (χ2-test) and general linear analyses were used to examine differences in the distribution of categorical variables, which included demographic and socioeconomic factors, chronic disease factors, and health behavior characteristics. Both simple and multiple logistic regression analyses were conducted for complex samples. These analyses aimed to calculate odds ratios (ORs) and 95% confidence intervals (CIs) for the relationship between cataracts, food groups, and nutrient intake. Model 1 was unadjusted and Model 2 was adjusted for age, sex, alcohol consumption, smoking status, and energy intake.
RESULTS
General characteristics of participants with or without cataracts
A descriptive analysis was conducted to examine general characteristics of participants. Results are presented in
Table 1. A total of 1,619 participants aged 60 years or older were included in this study, with a cataract prevalence of 51.8% (non-cataract group: 781 participants; cataract group: 838 participants). The age distribution showed that cataract prevalence was the highest among those in their 70s (p < 0.01). Regarding sex, 30.1% of participants were men and 69.9% were women, with women showing a higher prevalence of cataracts than men (p < 0.001). For smoking status, non-smokers accounted for 59.4% of the non-cataract group and 72.0% of the cataract group, while current smokers comprised 10.0% of the non-cataract group and 6.1% of the cataract group (p < 0.001). Among men, former smokers made up 63.8% of the non-cataract group and 65.7% of the cataract group. Among women, non-smokers were the most prevalent, accounting for 91.5% of the non-cataract group and 94.6% of the cataract group.
Table 1General characteristics of participants with or without cataracts
Table 1
|
Variables |
Total |
Men |
Women |
|
Non-cataract |
Cataract |
p value*
|
Non-cataract |
Cataract |
p value |
Non-cataract |
Cataract |
p value |
|
Age (yr) |
|
|
0.003 |
|
|
0.373 |
|
|
0.003 |
|
60–69 |
210 (26.9) |
265 (31.6) |
98 (28.9) |
79 (31.3) |
112 (25.3) |
186 (31.7) |
|
70–79 |
399 (51.1) |
453 (54.1) |
178 (52.5) |
133 (52.8) |
221 (50.0) |
320 (54.6) |
|
≥ 80 |
172 (22.0) |
120 (14.3) |
63 (18.6) |
40 (15.9) |
109 (24.7) |
80 (13.7) |
|
Sex |
|
|
0.000 |
|
|
- |
|
|
- |
|
Men |
339 (43.4) |
252 (30.1) |
- |
- |
- |
- |
|
Women |
442 (56.6) |
586 (69.9) |
- |
- |
- |
- |
|
Family income |
|
|
0.222 |
|
|
0.756 |
|
|
0.675 |
|
Low |
355 (45.6) |
423 (50.8) |
128 (37.9) |
105 (42.2) |
227 (51.6) |
318 (54.5) |
|
Lower-middle |
215 (27.6) |
222 (26.7) |
106 (31.4) |
77 (30.9) |
109 (24.8) |
145 (24.9) |
|
Upper-middle |
135 (17.4) |
115 (13.8) |
69 (20.4) |
43 (17.3) |
66 (15.0) |
72 (12.3) |
|
High |
73 (9.4) |
72 (8.7) |
35 (10.4) |
24 (9.6) |
38 (8.6) |
48 (8.2) |
|
Education |
|
|
0.179 |
|
|
0.903 |
|
|
0.923 |
|
Less than elementary |
448 (58.0) |
532 (63.9) |
129 (38.3) |
112 (44.6) |
319 (73.3) |
420 (72.3) |
|
Middle school |
107 (13.9) |
109 (13.1) |
58 (17.2) |
38 (15.1) |
49 (11.3) |
71 (12.2) |
|
High school |
140 (18.1) |
120 (14.4) |
92 (27.3) |
56 (22.3) |
48 (11.0) |
64 (11.0) |
|
College or higher |
77 (10.0) |
71 (8.5) |
58 (17.2) |
45 (17.9) |
19 (4.4) |
26 (4.5) |
|
Smoking status |
|
|
0.000 |
|
|
0.539 |
|
|
0.210 |
|
Non-smoker |
457 (59.4) |
595 (72.0) |
58 (17.4) |
51 (20.3) |
399 (91.5) |
544 (94.6) |
|
Former smoker |
236 (30.6) |
181 (21.9) |
213 (63.8) |
165 (65.7) |
23 (5.3) |
16 (2.8) |
|
Current smoker |
77 (10.0) |
50 (6.1) |
63 (18.9) |
35 (13.9) |
14 (3.2) |
15 (2.6) |
|
Alcohol consumption |
|
|
0.030 |
|
|
0.651 |
|
|
0.455 |
|
Non-drinker |
391 (50.8) |
441 (53.3) |
109 (32.6) |
89 (35.5) |
282 (64.7) |
352 (61.0) |
|
≥ 1–4 times/mon |
261 (33.9) |
294 (35.5) |
127 (38.0) |
94 (37.5) |
134 (30.7) |
200 (34.7) |
|
≥ 2–4 times/wk |
118 (15.3) |
93 (11.2) |
98 (29.3) |
68 (27.1) |
20 (4.6) |
25 (4.3) |
|
Obesity |
|
|
0.063 |
|
|
0.732 |
|
|
0.099 |
|
Low weight |
18 (2.3) |
21 (2.5) |
10 (2.9) |
6 (2.4) |
8 (1.8) |
15 (2.6) |
|
Normal |
275 (35.2) |
267 (32.0) |
132 (38.9) |
91 (36.1) |
143 (32.4) |
176 (30.2) |
|
Pre-obese stage |
185 (23.7) |
228 (27.3) |
81 (23.9) |
73 (29.0) |
104 (23.5) |
155 (26.6) |
|
Obesity |
303 (38.8) |
319 (38.2) |
116 (34.2) |
82 (32.5) |
187 (42.3) |
237 (40.7) |
|
Hypertension |
|
|
0.385 |
|
|
0.903 |
|
|
0.133 |
|
Normal |
107 (13.7) |
131 (15.6) |
56 (16.5) |
41 (16.3) |
51 (11.5) |
90 (15.4) |
|
Before hypertension |
173 (22.2) |
159 (19.0) |
79 (23.3) |
60 (23.8) |
94 (21.3) |
99 (16.9) |
|
Hypertension |
501 (64.1) |
548 (65.4) |
204 (60.2) |
151 (59.9) |
297 (67.2) |
397 (67.7) |
Regarding alcohol consumption, non-drinkers accounted for 50.8% of the non-cataract group and 53.3% of the cataract group, while drinking 2–4 times per week was reported by 15.3% of the non-cataract group and 11.2% of the cataract group (p < 0.05). Among men, drinking 1–4 times per month was the most common pattern. It was observed in 38.0% of the non-cataract group and 37.5% of the cataract group. Among women, non-drinkers were the most prevalent, accounting for 64.7% of the non-cataract group and 61.0% of the cataract group. There were significant differences in age, sex, smoking, and alcohol consumption among total participants between the cataract group and the non-cataract group, with a significant age-related difference observed among women.
ORs and 95% CIs of cataract by macronutrient intake
A logistic regression analysis was conducted to examine the association between macronutrient intake and odds of having cataracts. Results are presented in
Table 2. In Model 1, energy intake among all subjects was significantly lower in the highest quartile (Q4) with an OR of 0.64 (95% CI, 0.47–0.88), indicating a trend in which higher energy intake was associated with lower odds of having cataracts (p for trend = 0.044). Protein intake was significantly associated with reduced odds of having cataracts in the third (Q3) and fourth quartiles (Q4) with ORs of 0.66 (95% CI, 0.47–0.92) and 0.61 (95% CI, 0.45–0.84), respectively, in Model 1 (p < 0.05). A similar trend was observed, indicating that a higher protein intake was associated with lower odds of having cataracts (P for trend = 0.018). In Model 2, after adjusting for confounding variables, protein intake remained significantly lower in Q3 with an OR of 0.67 (95% CI, 0.46–0.99). Sex analysis showed that women in the highest quartile (Q4) had significantly lower odds of having cataracts, with an OR of 0.46 (95% CI, 0.26–0.82; Model 2, p < 0.05). In Q4, fat intake was also significantly associated with lower odds of having cataracts, with ORs of 0.64 (95% CI, 0.47–0.87) in Model 1 and 0.63 (95% CI, 0.42–0.94) in Model 2. A higher fat intake was associated with a significant inverse trend with the odds of having cataracts (p for trend < 0.05). However, when fat intake was analyzed by sex, no significant association was observed in men. In women, significantly higher odds of having cataracts were observed in Q2 of Model 1 (OR, 1.47; 95% CI, 1.00–2.16, p < 0.05), indicating that lower fat intake was associated with higher odds of having cataracts (p for trend = 0.004). In Model 2, after adjusting for confounding variables, the odds of having cataracts in Q4 remained significantly lower, with an OR of 0.51 (95% CI, 0.31–0.82, p < 0.05), confirming an inverse relationship between fat intake and odds of having cataracts (p for trend = 0.000). Among all subjects, those in the highest quartile (Q4) of SFA intake had significantly lower odds of having cataracts, with an OR of 0.65 (95% CI, 0.47–0.89) in Model 1 and 0.65 (95% CI, 0.43–0.97) in Model 2. A higher intake of SFA was associated with lower odds of having cataracts (p for trend < 0.05). When analyzed by sex, women exhibited a tendency toward lower odds of having cataracts in Q4 of Model 1, with an OR of 0.68 (95% CI, 0.47–1.00, p = 0.05). In Model 2, this reduction was significant with an OR of 0.51 (95% CI, 0.32–0.80, p < 0.05), indicating a consistent trend of lower odds of having cataracts with higher intake of SFA (p for trend < 0.05). MUFA intake was significantly associated with lower odds of having cataracts in Q4, with an OR of 0.61 (95% CI, 0.45–0.83) in Model 1 and 0.60 (95% CI, 0.41–0.88) in Model 2. A higher intake of MUFA was associated with lower odds of having cataracts (p for trend < 0.05). When analyzed by sex, men in the highest quartile (Q4) of MUFA intake had significantly lower odds of having cataracts in Model 1 (OR, 0.56; 95% CI, 0.33–0.94) in Model 1. In Model 2, the odds of having cataracts were significantly lower in Q2 with an OR of 0.56 (95% CI, 0.33–0.98). However, in Q2 among women, the odds of having cataracts were elevated, with an OR of 1.58 (95% CI, 1.06–2.36) in Model 1 and an OR of 1.51 (95% CI, 1.00–2.27) in Model 2. Notably, lower intake of MUFA was associated with higher odds of having cataracts (p for trend < 0.05).
Figure 2 presents a graph illustrating the relationship between the intake of protein, total fat, SFA, MUFA, and omega-6 fatty acids and cataract prevalence, suggesting that a higher intake of these nutrients is associated with lower prevalence of cataracts.
Table 2Odds ratios and 95% confidence intervals of cataract by macronutrients intake
Table 2
|
Nutrient |
Total |
Men |
Women |
|
Range |
Model 1*
|
Model 2†
|
Range |
Model 1 |
Model 2 |
Range |
Model 1 |
Model 2 |
|
Energy (kcal) |
|
|
|
|
|
|
|
|
|
|
Quartile 1 |
≤ 1,138 |
1 |
1 |
≤ 1,393 |
1 |
1 |
≤ 1,026 |
1 |
1 |
|
Quartile 2 |
1,138–1,479 |
0.75 (0.53–1.05) |
0.80 (0.56–1.15) |
1,393–1,793 |
1.30 (0.77–2.20) |
1.53 (0.86–2.72) |
1,026–1,325 |
0.84 (0.55–1.29) |
0.67 (0.40–1.12) |
|
Quartile 3 |
1,479–1,934 |
0.81 (0.59–1.12) |
0.96 (0.62–1.48) |
1,793–2,264 |
1.35 (0.79–2.31) |
1.94 (0.94–3.99) |
1,325–1,690 |
0.70 (0.45–1.09) |
0.46 (0.23–0.90)‡
|
|
Quartile 4 |
> 1,934 |
0.64 (0.47–0.88)‡
|
0.86 (0.46–1.61) |
> 2,264 |
1.00 (0.59–1.69) |
1.84 (0.64–5.30) |
> 1,690 |
0.84 (0.55–1.28) |
0.41 (0.16–1.08) |
|
p for trend |
|
0.044 |
0.558 |
|
0.521 |
0.312 |
|
0.473 |
0.167 |
|
Protein (g) |
|
|
|
|
|
|
|
|
|
|
Quartile 1 |
≤ 33.5 |
1 |
1 |
≤ 43.6 |
1 |
1 |
≤ 29.4 |
1 |
1 |
|
Quartile 2 |
33.5–47.1 |
0.73 (0.53–1.00) |
0.74 (0.53–1.03) |
43.6–58.6 |
0.83 (0.49–1.38) |
0.84 (0.49–1.44) |
29.4–41.6 |
0.80 (0.54–1.19) |
0.67 (0.44–1.03) |
|
Quartile 3 |
47.1–65.7 |
0.66 (0.47–0.92)‡
|
0.67 (0.46–0.99)‡
|
58.6–80.3 |
1.10 (0.67–1.82) |
1.23 (0.67–2.24) |
41.6–57.3 |
0.82 (0.54–1.24) |
0.63 (0.38–1.05) |
|
Quartile 4 |
> 65.7 |
0.61 (0.45–0.84)‡
|
0.67 (0.43–1.06) |
> 80.3 |
0.84 (0.51–1.40) |
0.99 (0.47–2.08) |
> 57.3 |
0.73 (0.50–1.09) |
0.46 (0.26–0.82)‡
|
|
p for trend |
|
0.018 |
0.184 |
|
0.635 |
0.576 |
|
0.463 |
0.070 |
|
Carbohydrate (g) |
|
|
|
|
|
|
|
|
|
|
Quartile 1 |
≤ 206 |
1 |
1 |
≤ 245.8 |
1 |
1 |
≤ 188.5 |
1 |
1 |
|
Quartile 2 |
206–267 |
0.79 (0.56–1.10) |
0.98 (0.68–1.41) |
245.8–307.3 |
1.02 (0.59–1.77) |
1.14 (0.63–2.07) |
188.5–247.8 |
1.03 (0.70–1.54) |
1.09 (0.70–1.69) |
|
Quartile 3 |
267–342 |
0.89 (0.63–1.24) |
1.30 (0.87–1.94) |
307.3–390.2 |
1.19 (0.71–2.01) |
1.44 (0.77–2.69) |
247.8–316.9 |
0.77 (0.51–1.18) |
0.88 (0.51–1.50) |
|
Quartile 4 |
> 342 |
0.85 (0.62–1.16) |
1.65 (0.98–2.78) |
> 390.2 |
0.93 (0.54–1.58) |
1.25 (0.54–2.89) |
> 316.9 |
1.15 (0.77–1.72) |
1.50 (0.71–3.18) |
|
p for trend |
|
0.551 |
0.132 |
|
0.801 |
0.687 |
|
0.256 |
0.176 |
|
Fat (g) |
|
|
|
|
|
|
|
|
|
|
Quartile 1 |
≤ 11.3 |
1 |
1 |
≤ 15.4 |
1 |
1 |
≤ 9.3 |
1 |
1 |
|
Quartile 2 |
11.3–20.2 |
1.10 (0.81–1.51) |
1.12 (0.81–1.55) |
15.4–26.7 |
1.00 (0.58–1.70) |
0.92 (0.53–1.62) |
9.3–17.4 |
1.47 (1.00–2.16)‡
|
1.35 (0.91–2.00) |
|
Quartile 3 |
20.2–34.2 |
0.95 (0.69–1.32) |
0.89 (0.63–1.26) |
26.7–43.4 |
0.83 (0.49–1.41) |
0.75 (0.42–1.34) |
17.4–28.1 |
1.22 (0.82–1.82) |
1.02 (0.66–1.57) |
|
Quartile 4 |
> 34.2 |
0.64 (0.47–0.87)‡
|
0.63 (0.42–0.94)‡
|
> 43.4 |
0.73 (0.43–1.22) |
0.69 (0.33–1.41) |
> 28.1 |
0.73 (0.49–1.08) |
0.51 (0.31–0.82)‡
|
|
p for trend |
|
0.004 |
0.029 |
|
0.498 |
0.675 |
|
0.004 |
0.000 |
|
Saturated fatty acid (g) |
|
|
|
|
|
|
|
|
|
|
Quartile 1 |
≤ 2.8 |
1 |
1 |
≤ 3.9 |
1 |
1 |
≤ 2.3 |
1 |
1 |
|
Quartile 2 |
2.8–5.4 |
1.04 (0.77–1.41) |
1.04 (0.75–1.43) |
3.9–7.5 |
0.78 (0.46–1.32) |
0.75 (0.43–1.30) |
2.3–4.6 |
1.30 (0.90–1.89) |
1.15 (0.77–1.71) |
|
Quartile 3 |
5.4–9.5 |
0.78 (0.57–1.07) |
0.76 (0.54–1.06) |
7.5–12.8 |
1.09 (0.62–1.92) |
0.97 (0.54–1.76) |
4.6–8.2 |
1.07 (0.72–1.59) |
0.89 (0.59–1.36) |
|
Quartile 4 |
> 9.5 |
0.65 (0.47–0.89)‡
|
0.65 (0.43–0.97)‡
|
> 12.8 |
0.61 (0.36–1.04) |
0.55 (0.28–1.10) |
> 8.2 |
0.68 (0.47–1.00) |
0.51 (0.32–0.80)‡
|
|
p for trend |
|
0.010 |
0.043 |
|
0.109 |
0.194 |
|
0.019 |
0.003 |
|
Monounsaturated fatty acid (g) |
|
|
|
|
|
|
|
|
|
|
Quartile 1 |
≤ 2.6 |
1 |
1 |
≤ 3.6 |
1 |
1 |
≤ 2.2 |
1 |
1 |
|
Quartile 2 |
2.6–5.4 |
0.97 (0.71–1.33) |
0.99 (0.71–1.37) |
3.6–7.1 |
0.61 (0.35–1.04) |
0.56 (0.33–0.98)‡
|
2.2–4.5 |
1.58 (1.06–2.36)‡
|
1.51 (1.00–2.27)‡
|
|
Quartile 3 |
5.4–10.0 |
0.91 (0.67–1.24) |
0.85 (0.62–1.18) |
7.1–13.0 |
0.92 (0.54–1.57) |
0.85 (0.48–1.53) |
4.5–8.2 |
1.01 (0.68–1.52) |
0.88 (0.57–1.36) |
|
Quartile 4 |
> 10.0 |
0.61 (0.45–0.83)‡
|
0.60 (0.41–0.88)‡
|
> 13.0 |
0.56 (0.33–0.94)‡
|
0.52 (0.26–1.03) |
> 8.2 |
0.88 (0.60–1.29) |
0.71 (0.45–1.11) |
|
p for trend |
|
0.005 |
0.036 |
|
0.064 |
0.077 |
|
0.028 |
0.009 |
|
Polyunsaturated fatty acid (g) |
|
|
|
|
|
|
|
|
|
|
Quartile 1 |
≤ 2.9 |
1 |
1 |
≤ 3.9 |
1 |
1 |
≤ 2.5 |
1 |
1 |
|
Quartile 2 |
2.9–5.4 |
1.32 (0.97–1.80) |
1.33 (0.97–1.81) |
3.9–6.9 |
0.67 (0.39–1.13) |
0.69 (0.41–1.17) |
2.5–4.4 |
1.19 (0.80–1.77) |
1.12 (0.73–1.70) |
|
Quartile 3 |
5.4–9.3 |
1.02 (0.76–1.37) |
1.04 (0.77–1.43) |
6.9–12.2 |
1.10 (0.66–1.85) |
1.13 (0.64–2.00) |
4.4–7.9 |
1.20 (0.82–1.75) |
1.08 (0.72–1.63) |
|
Quartile 4 |
> 9.3 |
0.80 (0.59–1.09) |
0.84 (0.57–1.23) |
> 12.2 |
0.65 (0.39–1.09) |
0.71 (0.36–1.37) |
> 7.9 |
0.93 (0.63–1.38) |
0.77 (0.48–1.22) |
|
p for trend |
|
0.024 |
0.076 |
|
0.128 |
0.209 |
|
0.498 |
0.303 |
|
N-3 fatty acid (g) |
|
|
|
|
|
|
|
|
|
|
Quartile 1 |
≤ 0.4 |
1 |
1 |
≤ 0.5 |
1 |
1 |
≤ 0.3 |
1 |
1 |
|
Quartile 2 |
0.4–0.8 |
0.91 (0.68–1.23) |
0.94 (0.69–1.27) |
0.5–1.1 |
1.15 (0.67–1.97) |
1.23 (0.71–2.15) |
0.3–0.7 |
0.80 (0.55–1.16) |
0.77 (0.52–1.15) |
|
Quartile 3 |
0.8–1.6 |
0.89 (0.66–1.20) |
1.02 (0.74–1.41) |
1.1–1.9 |
1.35 (0.80–2.25) |
1.59 (0.91–2.75) |
0.7–1.4 |
0.81 (0.54–1.20) |
0.79 (0.51–1.21) |
|
Quartile 4 |
> 1.6 |
0.89 (0.66–1.21) |
1.03 (0.74–1.45) |
> 1.9 |
1.28 (0.75–2.16) |
1.56 (0.87–2.81) |
> 1.4 |
0.87 (0.58–1.31) |
0.78 (0.49–1.23) |
|
p for trend |
|
0.844 |
0.940 |
|
0.693 |
0.361 |
|
0.617 |
0.575 |
|
N-6 fatty acid (g) |
|
|
|
|
|
|
|
|
|
|
Quartile 1 |
≤ 2.3 |
1 |
1 |
≤ 3.2 |
1 |
1 |
≤ 1.9 |
1 |
1 |
|
Quartile 2 |
2.3–4.2 |
1.17 (0.88–1.56) |
1.12 (0.83–1.51) |
3.2–5.6 |
0.63 (0.37–1.07) |
0.60 (0.35–1.02) |
1.9–3.6 |
1.28 (0.87–1.90) |
1.27 (0.84–1.94) |
|
Quartile 3 |
4.2–7.4 |
0.87 (0.64–1.18) |
0.85 (0.62–1.18) |
5.6–9.6 |
1.05 (0.64–1.73) |
1.03 (0.59–1.82) |
3.6–6.5 |
1.23 (0.84–1.81) |
1.11 (0.73–1.69) |
|
Quartile 4 |
> 7.4 |
0.75 (0.55–1.02) |
0.78 (0.53–1.15) |
> 9.6 |
0.59 (0.36–0.97)‡
|
0.58 (0.31–1.08) |
> 6.5 |
0.95 (0.65–1.39) |
0.79 (0.50–1.26) |
|
p for trend |
|
0.034 |
0.173 |
|
0.056 |
0.048 |
|
0.337 |
0.165 |
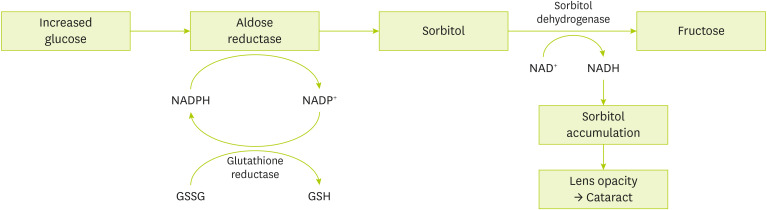
Figure 2The polyol pathway and aldose reductase: mechanisms of cataractogenesis.
ORs and 95% CIs of cataract by carbohydrate, protein, and fat energy ratios
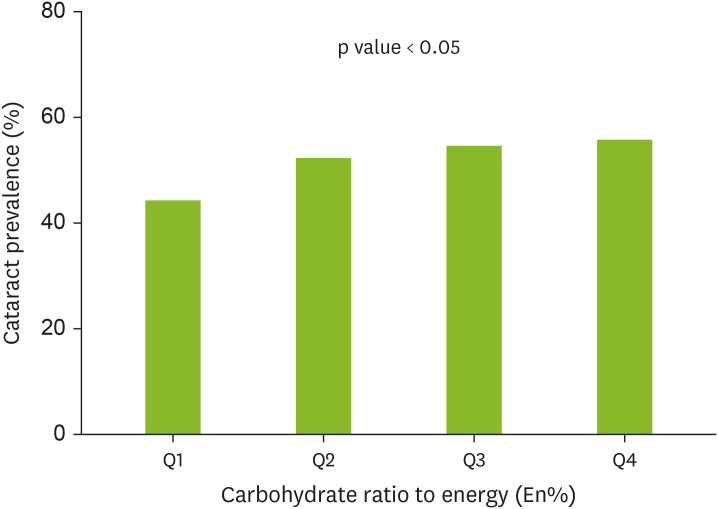
A logistic regression analysis was conducted to evaluate the odds of having cataracts in relation to the intake ratios of carbohydrates, protein, and fat relative to total energy intake. Detailed results are presented in
Table 3. Among all subjects, a higher carbohydrate-to-energy ratio was significantly associated with increased odds of having cataracts, with ORs of 1.47 (95% CI, 1.08–2.01) and 1.56 (95% CI, 1.12–2.15) in Model 1 (p < 0.05) (
Figure 3). In Model 2, this trend persisted, with an OR of 1.41 (95% CI, 0.99–2.01) observed in the highest quartile (Q4), indicating a marginally significant trend (p = 0.05). Additionally, a positive correlation was observed between carbohydrate-to-energy ratio and odds of having cataracts, with a p-value for trend of 0.022. When the analysis was stratified by sex, women in Q4 had significantly higher odds of having cataracts, with an OR of 1.52 (95% CI, 1.00–2.32; Model 2). For the protein-to-energy ratio, a significant reduction in odds of having cataracts was found in women in Q3, with ORs of 0.65 (95% CI, 0.44–0.97) in Model 1 and 0.59 (95% CI, 0.40–0.88) in Model 2 (p < 0.05). Among all participants, the fat-to-energy ratio was significantly associated with lower odds of having cataracts in Q4, with OR of 0.72 (95% CI, 0.52–0.99) in Model 1 and 0.69 (95% CI, 0.49–0.97) in Model 2 (p < 0.05).
Table 3Odds ratios and 95% confidence intervals of cataract by carbohydrate, protein, and fat energy ratio
Table 3
|
Nutrient |
Total |
Men |
Women |
|
Range |
Model 1*
|
Model 2†
|
Range |
Model 1 |
Model 2 |
Range |
Model 1 |
Model 2 |
|
Carbohydrate intake (%En) |
|
|
|
|
|
|
|
|
|
|
Quartile 1 |
≤ 66 |
1 |
1 |
≤ 63 |
1 |
1 |
≤ 69 |
1 |
1 |
|
Quartile 2 |
66–74 |
1.18 (0.86–1.62) |
1.09 (0.78–1.54) |
63–71 |
1.01 (0.58–1.76) |
0.92 (0.52–1.64) |
69–75 |
0.77 (0.46–1.31) |
1.18 (0.79–1.76) |
|
Quartile 3 |
74–80 |
1.47 (1.08–2.01)‡
|
1.37 (0.98–1.90) |
71–78 |
1.44 (0.86–2.40) |
1.29 (0.76–2.21) |
75–82 |
0.69 (0.40–1.19) |
1.39 (0.90–2.15) |
|
Quartile 4 |
> 80 |
1.56 (1.12–2.15)‡
|
1.41 (0.99–2.01) |
> 78 |
1.49 (0.86–2.60) |
1.43 (0.77–2.65) |
> 82 |
0.64 (0.36–1.15) |
1.52 (1.00–2.32) |
|
p for trend |
|
0.022 |
0.137 |
|
0.255 |
0.363 |
|
0.450 |
0.225 |
|
Protein intake (%En) |
|
|
|
|
|
|
|
|
|
|
Quartile 1 |
≤ 10 |
1 |
1 |
≤ 11 |
1 |
1 |
≤ 10 |
1 |
1 |
|
Quartile 2 |
10–12 |
0.75 (0.54–1.04) |
0.77 (0.55–1.07) |
11–13 |
0.80 (0.48–1.34) |
0.73 (0.42–1.26) |
10–12 |
0.73 (0.48–1.12) |
0.71 (0.46–1.09) |
|
Quartile 3 |
12–15 |
0.77 (0.56–1.06) |
0.78 (0.56–1.07) |
13–15 |
0.89 (0.53–1.47) |
0.80 (0.48–1.34) |
12–14 |
0.65 (0.44–0.97)‡
|
0.59 (0.40–0.88)‡
|
|
Quartile 4 |
> 15 |
0.77 (0.56–1.06) |
0.76 (0.55–1.06) |
> 15 |
0.79 (0.46–1.35) |
0.70 (0.40–1.21) |
> 14 |
0.78 (0.52–1.17) |
0.71 (0.47–1.07) |
|
p for trend |
|
0.259 |
0.293 |
|
0.797 |
0.579 |
|
0.195 |
0.078 |
|
Fat intake (%En) |
|
|
|
|
|
|
|
|
|
|
Quartile 1 |
≤ 8 |
1 |
1 |
≤ 8 |
1 |
1 |
≤ 7 |
1 |
1 |
|
Quartile 2 |
8–12 |
1.05 (0.76–1.43) |
0.99 (0.71–1.37) |
8–13 |
0.84 (0.50–1.42) |
0.77 (0.46–1.31) |
7–11 |
1.13 (0.73–1.74) |
1.03 (0.65–1.61) |
|
Quartile 3 |
12–18 |
0.95 (0.70–1.28) |
0.91 (0.66–1.25) |
13–19 |
0.76 (0.45–1.29) |
0.69 (0.40–1.19) |
11–17 |
0.89 (0.60–1.31) |
0.79 (0.53–1.19) |
|
Quartile 4 |
> 18 |
0.72 (0.52–0.99)‡
|
0.69 (0.49–0.97)‡
|
> 19 |
0.65 (0.38–1.12) |
0.64 (0.36–1.15) |
> 17 |
0.77 (0.52–1.14) |
0.68 (0.45–1.03) |
|
p for trend |
|
0.091 |
0.110 |
|
0.462 |
0.450 |
|
0.317 |
0.178 |
Figure 3Cataract prevalence across quartiles of carbohydrate-to-energy ratio among all subjects.

DISCUSSION
Cataract is an eye disease characterized by the clouding of the lens and is recognized as a one of the leading causes of blindness worldwide [
18]. Previous studies have emphasized that balanced nutrient intake is important for maintaining transparency of the lens [
5,
11]. This study analyzed the association between dietary macronutrients intake and cataract prevalence using data from the 6th and 7th Korea National Health and Nutrition Examination Surveys (KNHANES). The prevalence of cataracts among the study population was 51.8%, with the highest incidence observed in individuals in their 70s (54.1%). While most previous studies have reported that cataract prevalence increases with age [
8,
9], this study found a higher prevalence among individuals in their 70s compared to those in their 80s. This discrepancy may be attributed to higher cataract surgery rates among individuals in their 70s as reported in the surgery statistics of the Korea National Health Insurance Corporation [
9,
19].
Sex differences were observed, with women showing a significantly higher prevalence (69.9%) than men. The odds of having cataracts for women was 1.86 (OR, 1.86; 95% CI, 1.47–2.36) in Model 1 and 1.58 (OR, 1.58, 95% CI, 1.08–2.32) in Model 2 (p < 0.05). Previous studies [
20] have reported that estrogen deficiency, which occurs along with decreased ovarian function after menopause in women, damages the epithelial cells in the eye’s lens, thereby increasing the risk of having cataract development. This hormonal factor may partly explain the higher prevalence observed among women in this study and suggests that women may need to take greater precautions than men in preventing cataracts. Analysis of macronutrient intake showed that higher protein intake in Q3 (12%–14%) and Q4 (> 14%) was associated with approximately 0.6 and 0.7 times lower odds of having cataracts, respectively (p < 0.05). Among women, those in Q4 with the highest protein intake had approximately 50% lower odds of having cataracts (p < 0.05). Adequate protein intake enhances the availability of essential nutrients such as amino acids, zinc, iron, vitamin C, and vitamin B12, which play maintain roles in maintaining lens transparency [
12]. These findings are consistent with prior research reporting that consuming over 107 g of protein per day may reduce odds of having cataracts by approximately 72% [
18]. Regarding fat intake, individuals in the Q4 group with the highest fat consumption had a lower risk of having cataracts (p < 0.05), and similar results were observed among women. In contrast, those in the Q2 group with lower fat intake showed approximately 1.5 times higher odds of having cataracts. The fat intake range of the Q4 group corresponds to 15%–30% of total energy intake, which falls within the recommended range set by the Korean Dietary Reference Intakes (KDRIs). When fat intake is insufficient, carbohydrate intake tends to increase, which may contribute to a higher prevalence of cataracts [
18,
21]. However, previous studies [
9,
10] reported that fat intake among elderly Korean women was less than 15% of total energy intake, falling short of the recommended intake levels. This finding was consistent with the results of the present study. Mustafa and Daoud [
22] reported that older adults tend to restrict milk and dairy products to reduce their intake of SFA. However, the SFA found in milk and dairy products were not associated with cataracts or chronic diseases, and previous studies have suggested that there is no need to overly restrict foods rich in saturated fats, such as dairy products and eggs [
22,
23].
Additionally, Siri-Tarino et al. [
21] suggested that consuming SFA at less than 10% of total energy intake could help reduce the intake of refined carbohydrates, and thus recommended that SFA should not be overly restricted. Townend et al. [
18] reported that excessive intake of SFA not only reduced the total fat intake, but also increased carbohydrate intake, which eventually increased the risk of cataracts.
High carbohydrate intake was found to be strongly associated with increased odds of having cataracts. Q3 (74%–80%) and Q4 (> 80%) groups with the highest carbohydrate-to-energy intake ratios exhibited approximately 1.5 times higher odds of having cataracts. Excessive carbohydrate consumption may lead to elevated postprandial blood glucose levels, increased oxidative stress, and activation of the polyol pathway, ultimately contributing to lens damage [
24,
25,
26]. Previous studies have suggested that excessive carbohydrate intake may increase the odds of having cataracts [
24,
25,
26]. The polyol pathway plays a critical role in cataract formation. In hyperglycemic conditions, activation of the polyol pathway leads to the conversion of glucose to sorbitol by aldose reductase, consuming NADPH in the process. Because sorbitol is slowly converted to fructose, it accumulates within cells, inducing osmotic stress and structural damage to the lens. These events collectively contribute to lens opacity and cataract development (
Figure 2) [
26].
This study addresses the limited research available on the association between macronutrient intake and cataract prevalence in South Korea, offering valuable insights for dietary strategies to mitigate odds of having cataracts. Findings of this study indicate that excessive carbohydrate consumption, coupled with insufficient protein and fat intake, can increase the odds of having cataracts, particularly among women aged 60 years or older. Considering the progressive nature of cataract formation over time, implementing nutritional education among the general adult population may be beneficial for early prevention. Additionally, recognizing that all types of fats are important, saturated fat intake should ideally be limited to less than 7%, as recommended by the KDRIs [
27].
Given the cross-sectional nature of this study, it could not establish a causality, limiting the interpretation of observed associations. Additionally, the 24-hour recall method used for dietary data collection might not accurately reflect participants’ average daily intake. Nevertheless, the Korea National Health and Nutrition Examination Survey provides a large, representative dataset, making this study valuable for understanding the relationship between macronutrient intake and cataracts. The 2015–2017 survey cycle was selected for analysis because no research on eye diseases was conducted during this period, which could add significance to the present study. Further longitudinal studies are needed to analyze long-term effects of dietary modifications on cataract prevention, particularly among women.
This study has several limitations. First, its cross-sectional design limits the ability to infer causality. Second, dietary intake was assessed through a 24-hour recall, which might not reflect habitual consumption. Third, unmeasured confounders such as physical activity or sun exposure could have influenced study outcomes.
This study complements the limited existing research on the association between macronutrient intake and cataract prevalence in South Korea and provides meaningful evidence for developing dietary strategies to reduce the odds of having cataracts. The findings of this study suggest that excessive carbohydrate intake combined with insufficient protein and fat intake may be associated with increased odds of having cataracts, particularly among women aged 60 years or older. Accordingly, nutrition education focusing on increasing protein and fat intake while reducing carbohydrate consumption is necessary for this population. While all types of dietary fats are important for maintaining health, SFA intake should ideally be limited to less than 7% of total energy intake. Further longitudinal studies are warranted to clarify the long-term effects of dietary modifications on cataract prevention, especially in older women.
Institute of Information & Communications Technology Planning & Evaluation
IITP-2025-RS-2024-00436773
NOTES
-
Funding: This work was supported by the Institute of Information & Communications Technology Planning & Evaluation (IITP)-Innovative Human Resource Development for Local Intellectualization program grant funded by the Korea government (MSIT) (IITP-2025-RS-2024-00436773).
-
Conflict of Interest: The authors declare that they have no competing interests.
-
Author Contributions:
Conceptualization: Park E, Choi J.
Data curation: Choi J.
Formal analysis: Choi J.
Investigation: Choi J.
Methodology: Choi J.
Project administration: Park E, Choi J.
Resources: Choi J.
Software: Choi J.
Supervision: Park E.
Validation: Choi J.
Visualization: Park E, Choi J.
Writing - original draft: Choi J.
Writing - review & editing: Park E, Choi J.
REFERENCES
- 1. Weikel KA, Garber C, Baburins A, Taylor A. Nutritional modulation of cataract. Nutr Rev 2014;72:30-47.
- 2. Catholic University of Medicine. Cataract. Seoul: Ilchokak; 2014.
- 3. National Institutes of Health (US). Eye health data and statistics. 2024. cited 2020 June 6. Available from: https://www.nei.nih.gov/learn-about-eye-health/resources-for-health-educators/eye-health-data-and-statistics/cataract-data-and-statistics
- 4. Korea Statistics Portal. Health insurance. 2025. cited 2025 January 2. Available from: https://kosis.kr/search/search.do?query=%EA%B1%B4%EA%B0%95%EB%B3%B4%ED%97%98
- 5. Rim HT, Woo YJ, Park HJ, Kim SS. The epidemiologic survey committee in the Korean Ophthalmological Society. Current status and future expectations of cataract surgery in Korea: KNHANES IV. J Korean Ophthalmol Soc 2014;55:1772-1778.
- 6. Kim JS, Lee SM, Kang JH, Ahn HS. Intakes of antioxidant nutrients and carotenoids according to lens turbidity level among adults visiting cataract clinic. Korean J Community Nutr 2012;17:205-214.
- 7. Park JH. A study on eye health equity in Korean adults: focused on the low vision and frequent eye diseases [dissertation]. Yongin: Dankook University; 2011.
- 8. Hwang HK. Relationship between metabolic syndrome and ophthalmic health in Korean adults: based on the 5th Korea National Health and Nutrition Examination Survey [dissertation]. Daegu: Keimyung University; 2014.
- 9. Han GS, Yang EJ. Evaluation of dietary habit and nutritional intake of Korean elderly: data from Korea National Health and Nutrition Examination Survey 2013–2015. J East Asian Soc Diet Life 2018;28:258-271.
- 10. Soh SM, Chung SJ, Yoon J. Dietary and health characteristics of Korean adults according to the level of energy intake from carbohydrate: analysis of the 7th (2016–2017) Korea National Health and Nutrition Examination Survey data. Nutrients 2020;12:429.
- 11. Lee JS. Risk factors of dietary intake affecting cataract [master's thesis]. Seoul: Ewha Woman’s University; 2009.
- 12. Cumming RG, Mitchell P, Smith W. Diet and cataract: the Blue Mountains Eye Study. Ophthalmology 2000;107:450-456.
- 13. Lu M, Taylor A, Chylack LT Jr, Rogers G, Hankinson SE, et al. Dietary fat intake and early age-related lens opacities. Am J Clin Nutr 2005;81:773-779.
- 14. Statistics Korea. 2019 statistics of the aged. 2019. cited 2020 June 6. Available from: https://kostat.go.kr
- 15. Kim EK, Kim H, Kwon O, Chang N. Associations between fruits, vegetables, vitamin A, β-carotene and flavonol dietary intake, and age-related macular degeneration in elderly women in Korea: the Fifth Korea National Health and Nutrition Examination Survey. Eur J Clin Nutr 2018;72:161-167.
- 16. Park J, Kwock CK, Yang YJ. The effect of the sodium to potassium ratio on hypertension prevalence. Nutrients 2016;8:1-16.
- 17. Korean Society for the Study of Obesity. Obesity care guidelines 2018. Seoul: Cheong-un Books; 2018.
- 18. Townend BS, Townend ME, Flood V, Burlutsky G, Rochtchina E, et al. Dietary macronutrient intake and five-year incident cataract: the blue mountains eye study. Am J Ophthalmol 2007;143:932-939.
- 19. National Health Insurance Corporation. 2016 surgical statistics. Seoul: NHIC; 2016-2017.
- 20. Zetterberg M, Celojevic D. Gender and cataract--the role of estrogen. Curr Eye Res 2015;40:176-190.
- 21. Siri-Tarino PW, Sun Q, Hu FB, Krauss RM. Saturated fat, carbohydrate, and cardiovascular disease. Am J Clin Nutr 2010;91:502-509.
- 22. Mustafa OM, Daoud YJ. Is dietary milk intake associated with cataract extraction history in older adults? an analysis from the US population. J Ophthalmol 2020;2020:2562875.
- 23. Astrup A, Magkos F, Bier DM, Brenna JT, de Oliveira Otto MC, et al. Saturated fats and health: a reassessment and proposal for food-based recommendations: JACC state-of-the-art review. J Am Coll Cardiol 2020;76:844-857.
- 24. Wu H, Zhang H, Li P, Gao T, Lin J, et al. Association between dietary carbohydrate intake and dietary glycemic index and risk of age-related cataract: a meta-analysis. Invest Ophthalmol Vis Sci 2014;55:3660-3668.
- 25. Evans JL, Goldfine ID, Maddux BA, Grodsky GM. Oxidative stress and stress-activated signaling pathways: a unifying hypothesis of type 2 diabetes. Endocr Rev 2002;23:599-622.
- 26. Brownlee M. Biochemistry and molecular cell biology of diabetic complications. Nature 2001;414:813-820.
- 27. Ministry of Health and Welfare. The Korean Nutrition Society. Dietary Reference Intakes for Koreans 2020. Sejong: Ministry of Health and Welfare; 2020.