ABSTRACT
Previous studies have shown the inverse association between diet quality and cancer mortality. Therefore, this study aims to discover the factors that affect diet quality among cancer survivors. We analyzed the 12 years of Korea National Health and Nutrition Examination Survey data, which included 2,756 cancer survivors. We analyzed 30 factors considered to be associated with diet quality. As a result, factors related to diet quality differed between males and females. A male cancer survivor who is aged < 65, living with members of the household, living without a spouse, having a lower household income, a blue-collar worker, a beneficiary of national basic livelihood, sleeping > 9 hours a day, unaware of a nutritional fact label, insecure in food, non-user of dietary supplements, not on diet therapy, limited in activity, perceiving stress, and obese, are more likely to have lower Korean Healthy Eating Index (KHEI) scores. On the other hand, a female cancer survivor who is aged < 65, a pink-collar worker, inexperienced in nutritional education, non-users of dietary supplements, obese, and has a lower education level, and cervical or stomach cancer is prone to have lower KHEI scores. In conclusion, factors associated with diet quality among cancer survivors are sex-specific. Therefore, sex-specific factors should be considered when identifying and intervening in cancer survivors at risk for lower diet quality scores.
-
Keywords: Dietary pattern; Cancer survivor; Cross-sectional studies; Risk factors
INTRODUCTION
According to data from Statistics Korea, cancer was the number one cause of death in South Korea in 2023. When looking at the causes of death over the 10 years from 2013 to 2023, cancer remained the number one cause of death. Furthermore, cancer is the number one cause of death for both males and females. In 2023, cancer claimed the lives of 85,271 people in South Korea, a 2.3 percent increase from the previous year [
1].
Life-related factors are associated with the risk or mortality of cancer [
2,
3]. One of these factors is dietary habits. Many previous studies regarding nutrients, food components, and dietary patterns or diet quality have shown their relation to cancer mortality.
Early studies mainly related to the association between cancer and single nutrients, individual foods, or food components. However, more recent studies focus on the idea that the diet is complicated, and food and nutrients are ingested together and often act synergistically [
4,
5,
6]. In this context, an effort has been made to discover the association between dietary patterns and health risks [
7]. Higher index scores in the Dietary Approaches to Stop Hypertension diet, the Alternative Healthy Eating Index, the Healthy Eating Index (HEI), the Diet Quality Index (DQI), alternative Mediterranean Diet, and HEI-2010 were associated with 9%–24% decreased in the risk of cancer mortality [
8,
9,
10].
Therefore, it is crucial to discover the factors that affect the DQI among cancer survivors. This study explored diet quality-related factors such as socio-demographic, health and diet behavioral, health status, anthropometric, and cancer-related categories. Moreover, the present study focused on sex-specific factors associated with lower diet quality scores. Males and females differ biologically in nutrient intake, metabolism, and the gut microbiome [
11]. Sex differences are also shown socio-culturally in nutritional behavior, such as nutritional knowledge, eating behavior, preparation skills, and taste preferences [
12]. We aim to identify statistically significant factors affecting diet quality, separately for males and females, and to improve the modifiable factors identified to increase the diet quality score and ultimately reduce mortality in cancer survivors.
MATERIALS AND METHODS
Study design and subjects
We analyzed nationwide cross-sectional survey data from 2008 to 2019, namely the Korea National Health and Nutrition Examination Survey (KNHANES). This survey was established in 1998 to estimate the health and nutritional status of the non-institutionalized Korean population and has been conducted periodically by the Korea Centers for Disease Control and Prevention (KCDC). The sampling method is a stratified multistage clustered probability design.
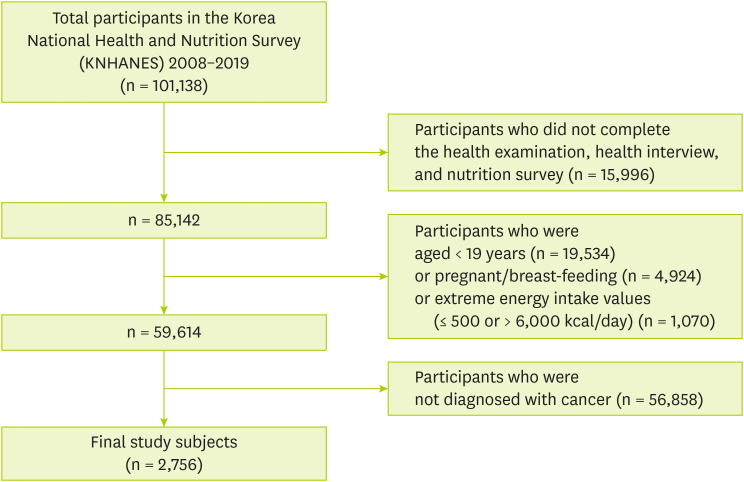
Figure 1 shows that 101,138 individuals who participated in KNHANES from 2008 to 2019. Among participants, we excluded those who were not eligible for the current study according to the exclusion criteria as follows: 1) Participants who did not complete the health examination, health interview, and nutrition survey (n = 15,996), 2) Participants under the age of 19 (n = 19,534), 3) Participants who were pregnant or breast-feeding (n = 2,533), 4) Participants who had extreme energy intake values (≤ 500 or > 6,000 kcal/day) (n = 735), 5) Participants who were not diagnosed with cancer (n = 59,584). Finally, 2,756 subjects were included and named cancer survivors.
Figure 1Study subjects included in the study.
A “cancer survivor” is defined as one who has been diagnosed with cancer and belongs to the period from the time of diagnosis until the end of life [
13]. The term “cancer survivor” was introduced by pediatrician Fitzhugh Mullan, who was diagnosed with cancer in 1975. In 1985, he published an article in the New England Journal of Medicine presenting “cancer survivorship” as a transition from acute illness to extended survival. This concept challenges the “cured/not cured” distinction and highlights the shared experiences of individuals living with cancer, regardless of prognosis, setting them apart from the general population. Many papers have used this concept [
14].
Cancer survivors in this study were defined as participants who self-reported having been diagnosed by a doctor, including all types of cancer. The final study subjects included cancer survivors regardless of when they were diagnosed, whether they were diagnosed with multiple cancers, reported other chronic conditions such as diabetes or hypertension, or were on diet therapy, to include the most significant number of cancer survivors in the study. Therefore, the analysis included these factors under the names “self-reported chronic disease,” “years since diagnosis,” “number of diagnosed cancers,” and “on diet therapy.”
The Korean Centers for Disease Control and Prevention Institutional Review Board approved the KNHANES (No. 2008-04EXP-01-C, 2009-01CON-03-2C, 2010-02CON-21-C, 2011-02CON-06-C, 2012-01EXP-01-2C, 2013-07CON-03-4C, 2013-12EXP-03-5C, 2018-01-03-P-A, 2018-01-03-CA), and all participants signed a written informed consent form.
Variables
Socio-demographic, health, and diet behavioral, health status, anthropometric, and cancer-related factors
Thirty factors were analyzed as independent variables to explore their association with diet quality. Factors were grouped into five categories, including socio-demographic factors (n = 8), health and diet behavioral factors (n = 12), health status factors (n = 5), anthropometric factors (n = 2), and cancer-related factors (n = 3).
Socio-demographic factors include age, marital status, residential area, household type, educational level, household income, occupation, and benefit of national basic livelihood. Health and diet behavioral factors include alcohol drinking, smoking, physical activity, sleep duration, nutrition labeling awareness, nutritional education and counseling, eating with family, food security, eating-out frequency, dietary supplement use, diet therapy, and the amount of water intake. Health status factors consist of self-reported health status, self-reported chronic diseases, limitation of activities, perceived poor oral health, and perceived stress. Anthropometric factors include body mass index (BMI) and waist circumference. Cancer-related factors include types of cancer, years since diagnosis, and number of diagnosed cancers.
The Korean HEI (KHEI)
We assessed individuals’ diet quality based on the KHEI reported in 2021 as a dependent variable [
15]. Due to the lack of data on saturated fatty acids, one component (the percentage of energy from saturated fatty acids) of the KHEI-2021 was replaced with another component (the ratio of white meat to red meat) of the KHEI-2015 [
16].
The KHEI was developed by the KCDC in 2015 to evaluate overall diet quality and adherence to dietary guidelines for Koreans [
16]. The initial KHEI (the KHEI-2015) was revised in 2021 (the KHEI-2021), reflecting the KNHANES database, dietary guidelines, and the 2015 KDRI (Dietary Reference Intakes for Koreans). The total KHEI score ranges from 0 to 100 points.
Statistical analyses were performed with SAS software, version 9.4 (SAS Institute Inc, Cary, NC, USA), and PROC SURVEYFREQ, PROC SURVEYMEANS, and PROC SURVEYREG procedures were used for estimating all statistical results to reflect the multistage, stratified survey design and survey weightings. The new sampling weight for a subject was calculated by dividing the year-specific sampling weight by the number of survey years. This sampling weight was applied to all analyses. A two-sided p value < 0.05 was considered to be statistically significant.
Estimated percentages and standard errors (SE) in the study population's general characteristics were weighted by the new sampling weight and described as age- and/or sex-adjusted values. The χ2 test estimated differences of % by sex.
All values of the means and SE of the KHEI scores were age- and/or sex-adjusted. Mean differences in the KHEI score were evaluated using multivariate linear regression after adjusting for age and/or sex. Multiple comparisons of mean differences were conducted using Tukey’s test.
All variables that showed significant mean differences in the KHEI scores between males and females were included for a multivariate linear regression analysis. By multivariate linear regression analysis, we identified the effect of sex on the KHEI scores and explored factors associated with the KHEI scores for male and female cancer survivors separately. Stepwise regression was used to select significant variables in a multivariate linear regression analysis. The variance inflation factors (VIF) were evaluated to check for multicollinearity, which was not considered a problem if the VIF was less than 10 [
17].
RESULTS
General characteristics of cancer survivors
Tables 1 and
2 shows the general characteristics between male and female cancer survivors. Of the 30 characteristics, 19 (63.3%) were significantly different between males and females, meaning that most general characteristics differed between males and females.
Table 1Socio-demographic and behavioral characteristics of cancer survivors
Table 1
|
Characteristics |
Total (n = 2,756) |
Male (n = 1,025)*
|
Female (n = 1,731)*
|
p value†
|
|
Socio-demographic characteristics |
|
|
|
|
|
Sex |
|
|
|
|
|
|
Male |
1,025 (38.1) |
|
|
|
|
Female |
1,731 (61.9) |
|
|
|
Age (yr) |
|
|
|
< 0.001 |
|
|
19–64 |
1,433 (60.8) |
365 (48.8) |
1,068 (68.2) |
|
|
≥ 65 |
1,323 (39.2) |
660 (51.2) |
663 (31.8) |
|
Marital status |
|
|
|
< 0.001 |
|
|
Living with spouse |
2,119 (77.7) |
892 (85.6) |
1,227 (72.7) |
|
|
Living without spouse |
627 (22.3) |
130 (14.4) |
497 (27.3) |
|
Residence |
|
|
|
0.001 |
|
|
Urban |
2,073 (80.6) |
735 (77.3) |
1,338 (82.7) |
|
|
Rural |
683 (19.4) |
290 (22.7) |
393 (17.3) |
|
Household type |
|
|
|
0.016 |
|
|
Single |
343 (9.4) |
86 (7.5) |
257 (10.6) |
|
|
Non-single |
2,413 (90.6) |
939 (92.5) |
1,474 (89.4) |
|
Education level |
|
|
|
< 0.001 |
|
|
≤ Elementary school |
1,030 (30.6) |
347 (26.6) |
683 (33.0) |
|
|
Middle school |
396 (14.2) |
151 (14.0) |
245 (14.2) |
|
|
High school |
745 (29.7) |
261 (26.7) |
484 (31.5) |
|
|
≥ College |
577 (25.6) |
259 (32.7) |
318 (21.2) |
|
Household income |
|
|
|
0.012 |
|
|
Q1 (lowest) |
846 (24.8) |
343 (26.6) |
503 (23.8) |
|
|
Q2 |
730 (25.0) |
303 (28.0) |
427 (23.3) |
|
|
Q3 |
573 (23.2) |
189 (21.7) |
384 (24.1) |
|
|
Q4 (highest) |
587 (26.9) |
185 (23.7) |
402 (28.8) |
|
Occupation |
|
|
|
< 0.001 |
|
|
White collar |
307 (14.8) |
139 (20.1) |
168 (11.6) |
|
|
Pink collar |
236 (10.0) |
52 (6.9) |
184 (12.0) |
|
|
Blue collar |
558 (18.5) |
267 (23.8) |
291 (15.3) |
|
|
Unemployed |
1,645 (56.6) |
558 (49.2) |
1,087 (61.2) |
|
The benefit of national basic livelihood |
|
|
|
0.719 |
|
|
Yes |
249 (8.6) |
87 (91.4) |
162 (8.8) |
|
|
No |
2,505 (91.4) |
938 (91.7) |
1,567 (91.2) |
|
Health and diet behavioral characteristics |
|
|
|
|
|
Alcohol drinking |
|
|
|
< 0.001 |
|
|
Yes |
2,192 (83.1) |
945 (94.5) |
1,247 (76.1) |
|
|
No |
552 (16.9) |
71 (5.5) |
481 (23.9) |
|
Smoking |
|
|
|
< 0.001 |
|
|
Never |
1,752 (64.0) |
165 (17.8) |
1,587 (92.1) |
|
|
Former |
777 (27.6) |
693 (65.1) |
84 (4.7) |
|
|
Current |
214 (8.4) |
157 (17.1) |
57 (3.1) |
|
High physical activity |
|
|
|
0.374 |
|
|
Yes |
1,034 (40.6) |
378 (41.9) |
656 (39.8) |
|
|
No |
1,706 (59.4) |
636 (58.1) |
1,070 (60.2) |
|
Sleep duration (hr) |
|
|
|
0.001 |
|
|
Short (< 7) |
1,020 (41.7) |
333 (36.8) |
687 (44.7) |
|
|
Normal (7–9) |
1,293 (54.0) |
502 (57.2) |
791 (52.1) |
|
|
Long (> 9) |
100 (4.2) |
50 (6.0) |
50 (3.2) |
|
Nutrition labeling awareness |
|
|
|
< 0.001 |
|
|
Yes |
1,624 (65.1) |
502 (56.3) |
1,122 (70.5) |
|
|
No |
1,131 (34.9) |
523 (43.7) |
608 (29.5) |
|
Nutritional education and counseling |
|
|
|
0.325 |
|
|
Yes |
215 (7.7) |
85 (8.5) |
130 (7.2) |
|
|
No |
2,537 (92.3) |
940 (91.5) |
1,597 (92.8) |
|
Eating with family |
|
|
|
0.011 |
|
|
Yes |
2,152 (82.8) |
865 (85.8) |
1,287 (80.9) |
|
|
No |
423 (17.2) |
121 (14.2) |
302 (19.1) |
|
Food security |
|
|
|
0.983 |
|
|
Yes |
1,350 (50.6) |
503 (50.6) |
847 (50.6) |
|
|
No |
1,403 (49.4) |
520 (49.4) |
883 (49.3) |
|
Eating out (/w) |
|
|
|
< 0.001 |
|
|
High (≥ 3) |
898 (36.0) |
366 (42.1) |
532 (32.2) |
|
|
Low (≤ 2) |
1,858 (64.0) |
659 (57.9) |
1,199 (67.8) |
|
Supplement use |
|
|
|
< 0.001 |
|
|
Yes |
1,456 (54.1) |
441 (44.4) |
1,015 (60.0) |
|
|
No |
1,298 (45.9) |
584 (55.6) |
714 (40.0) |
|
On diet therapy |
|
|
|
0.469 |
|
|
Yes |
916 (33.1) |
349 (34.1) |
567 (32.5) |
|
|
No |
1,835 (66.9) |
674 (65.9) |
1,161 (67.5) |
|
Water drinking (mL/day) |
|
|
|
0.346 |
|
|
High (≥ 962) |
1,342 (51.1) |
524 (52.4) |
818 (50.2) |
|
|
Low (< 962) |
1,414 (48.9) |
501 (47.6) |
913 (49.8) |
Table 2Health status, anthropometric, and cancer-related characteristics of cancer survivors
Table 2
|
Characteristics |
Total (n = 2,756) |
Male (n = 1,025)*
|
Female (n = 1,731)*
|
p value† |
|
Health status characteristics |
|
|
|
|
|
Self-reported health status |
|
|
|
< 0.001 |
|
|
Good to very good |
555 (20.4) |
263 (26.1) |
292 (16.9) |
|
|
Very bad to medium |
2,200 (79.6) |
762 (73.9) |
1,438 (83.1) |
|
Self-reported chronic disease |
|
|
|
0.478 |
|
|
Yes |
1,561 (61.6) |
588 (62.7) |
973 (60.9) |
|
|
No |
745 (38.4) |
267 (37.3) |
478 (39.1) |
|
Limitation of activities |
|
|
|
0.065 |
|
|
Yes |
558 (17.9) |
228 (19.8) |
330 (16.7) |
|
|
No |
2,196 (82.1) |
795 (80.2) |
1,401 (83.3) |
|
Perceived poor oral health |
|
|
|
0.034 |
|
|
Yes |
958 (32.6) |
389 (35.6) |
569 (30.8) |
|
|
No |
1,774 (67.4) |
623 (64.4) |
1,151 (69.2) |
|
Perceived stress |
|
|
|
0.002 |
|
|
Yes |
636 (23.2) |
192 (19.0) |
444 (25.7) |
|
|
No |
2,106 (76.8) |
823 (81.0) |
1,283 (74.3) |
|
Anthropometric characteristics |
|
|
|
|
|
Body mass index |
|
|
|
0.074 |
|
|
Underweight |
121 (4.4) |
61 (5.3) |
60 (3.8) |
|
|
Normal |
1,149 (42.0) |
442 (41.3) |
707 (42.4) |
|
|
Overweight |
651 (23.1) |
260 (25.2) |
391 (21.8) |
|
|
Obesity |
829 (30.6) |
259 (28.2) |
570 (32.0) |
|
Waist circumference |
|
|
|
0.639 |
|
|
≥ 90 cm (male)/85 cm (female) |
833 (29.9) |
286 (29.3) |
547 (30.3) |
|
|
< 90 cm (male)/85 cm (female) |
1,923 (70.1) |
739 (70.7) |
1,184 (69.7) |
|
Cancer-related characteristics |
|
|
|
|
|
Type of cancer |
|
|
|
< 0.001 |
|
|
Stomach |
496 (16.3) |
307 (26.7) |
189 (10.0) |
|
|
Liver |
61 (2.4) |
49 (5.3) |
12 (0.5) |
|
|
Colon |
285 (10.0) |
175 (16.5) |
110 (6.0) |
|
|
Breast |
378 (13.0) |
0 (0) |
378 (21.0) |
|
|
Cervix |
309 (11.2) |
0 (0) |
309 (18.0) |
|
|
Lung |
93 (3.0) |
68 (6.2) |
25 (1.0) |
|
|
Other |
1,134 (44.1) |
426 (45.3) |
708 (43.4) |
|
Years since diagnosis (yr) |
|
|
|
< 0.001 |
|
|
< 2 |
397 (14.6) |
183 (18.8) |
214 (12.0) |
|
|
≥ 2 to < 5 |
715 (26.9) |
262 (25.5) |
453 (27.8) |
|
|
≥ 5 to < 10 |
781 (28.7) |
321 (30.5) |
460 (27.5) |
|
|
≥ 10 |
858 (29.9) |
258 (25.2) |
600 (32.7) |
|
Number of diagnosed cancers |
|
|
|
0.274 |
|
|
1 |
2,630 (95.7) |
962 (95.0) |
1,668 (96.0) |
|
|
≥ 2 |
126 (4.3) |
63 (5.0) |
63 (4.0) |
The KHEI scores by KHEI components and sex among cancer survivors
Table 3 compares the mean KHEI score of male and female cancer survivors. The total mean score of the KHEI for both sexes was 62.8 (SE = 0.34). Female cancer survivors’ total mean score of KHEI was higher than the male’s (65.2 ± 0.40 for the female; 60.3 ± 0.60 for the male, p < 0.001). The higher scores for female cancer survivors may be due to female cancer survivors consuming more total and fresh fruit and less sodium and simple sugars compared to male cancer survivors. In addition, male cancer survivors scored higher than female cancer survivors for total vegetable intake. Still, they scored the same as female cancer survivors for vegetable intake, excluding kimchi and pickled vegetables. Therefore, the higher total vegetable intake score for males can be attributed to the consumption of kimchi and pickled vegetables.
Table 3The mean value of each KHEI item by sex among cancer survivors
Table 3
|
Components |
Score range |
Total* (n = 2,756) |
Male† (n = 1,025) |
Female† (n = 1,731) |
p value‡
|
|
Total score§
|
0–100 |
62.8 ± 0.34 |
60.3 ± 0.60 |
65.2 ± 0.40 |
< 0.001 |
|
Adequacy (8) |
0–55 |
|
|
|
|
|
Have breakfast |
0–10 |
9.5 ± 0.04 |
9.5 ± 0.08 |
9.5 ± 0.05 |
0.742 |
|
Mixed grains intake |
0–5 |
2.3 ± 0.05 |
2.3 ± 0.08 |
2.4 ± 0.06 |
0.448 |
|
Total fruits intake |
0–5 |
2.7 ± 0.05 |
2.3 ± 0.09 |
3.0 ± 0.06 |
< 0.001 |
|
Fresh fruits intake |
0–5 |
3.0 ± 0.05 |
2.7 ± 0.10 |
3.4 ± 0.06 |
< 0.001 |
|
Total vegetable intake |
0–5 |
3.2 ± 0.04 |
3.2 ± 0.07 |
3.0 ± 0.05 |
0.039 |
|
Vegetable intake, excluding Kimchi and pickled vegetable intake |
0–5 |
2.6 ± 0.04 |
2.5 ± 0.07 |
2.7 ± 0.05 |
0.143 |
|
Meat, fish, eggs, and beans intake |
0–10 |
5.5 ± 0.08 |
5.5 ± 0.14 |
5.4 ± 0.10 |
0.419 |
|
Milk and milk product intake |
0–10 |
2.8 ± 0.10 |
2.7 ± 0.16 |
3.0 ± 0.12 |
0.084 |
|
Moderation (3) |
0–25 |
|
|
|
|
|
The ratio of white meat to red meat |
0-5 |
3.1 ± 0.06 |
3.0 ± 0.10 |
3.2 ± 0.07 |
0.199 |
|
Sodium intake |
0–10 |
6.5 ± 0.08 |
5.7 ± 0.14 |
7.3 ± 0.09 |
< 0.001 |
|
Percentage of energy from sweets and beverages |
0–10 |
8.8 ± 0.07 |
8.3 ± 0.14 |
9.4 ± 0.06 |
< 0.001 |
|
Energy balance (3) |
0–15 |
|
|
|
|
|
Percentage of energy from carbohydrate |
0–5 |
2.0 ± 0.05 |
2.1 ± 0.09 |
2.0 ± 0.06 |
0.152 |
|
Percentage of energy intake from fat |
0–5 |
2.9 ± 0.05 |
2.8 ± 0.08 |
2.9 ± 0.06 |
0.673 |
|
Energy intake |
0–5 |
3.2 ± 0.05 |
3.3 ± 0.09 |
3.2 ± 0.06 |
0.544 |
The KHEI scores by factors and sex among cancer survivors
Table 4 shows that KHEI scores by sex differ across subgroups of the factors. When comparing subgroups within the same factor between males and females, there were statistically significant differences in KHEI scores for most factor subgroups. However, smoking and cancer type did not differ across all subgroups, and household type, household income, occupation, sleep duration, activity limitations, BMI, years since diagnosis, and number of diagnosed cancers did not differ in some subgroups.
Table 4The mean value of the Korean Healthy Eating Index score by factors and sex among cancer survivors
Table 4
|
Factors |
Total* (n = 2,756) |
p value†
|
Male‡ (n = 1,025) |
Female‡ (n = 1,731) |
p value§
|
|
Total score |
62.8 ± 0.3 |
|
60.3 ± 0.6 |
65.2 ± 0.4 |
< 0.001 |
|
Socio-demographic factors |
|
|
|
|
|
|
Age (yr) |
|
0.155 |
|
|
< 0.001 |
|
|
19–64 |
62.4 ± 0.5 |
59.4 ± 0.8b
|
65.0 ± 0.5a
|
|
|
≥ 65 |
63.4 ± 0.6 |
61.6 ± 0.8b
|
65.2 ± 0.7a
|
|
Marital status |
|
< 0.001 |
|
|
< 0.001 |
|
|
Living with spouse |
63.5 ± 0.4 |
61.2 ± 0.6b
|
65.8 ± 0.5a
|
|
|
Living without spouse |
60.0 ± 0.8 |
54.8 ± 1.7c
|
63.6 ± 0.8ab
|
|
Residence |
|
< 0.001 |
|
|
< 0.001 |
|
|
Urban |
63.4 ± 0.4 |
61.2 ± 0.7b
|
65.6 ± 0.5a
|
|
|
Rural |
60.3 ± 0.7 |
57.5 ± 1.1c
|
63.1 ± 0.9ab
|
|
Household type |
|
0.933 |
|
|
< 0.001 |
|
|
Single |
62.9 ± 1.1 |
61.0 ± 2.1ab
|
65.0 ± 1.1a
|
|
|
Non-single |
62.8 ± 0.4 |
60.3 ± 0.6b
|
65.2 ± 0.4a
|
|
Education level |
|
< 0.001 |
|
|
< 0.001 |
|
|
≤ Elementary school |
58.0 ± 0.7γ
|
55.5 ± 1.3e
|
60.7 ± 0.8cd
|
|
|
Middle school |
61.1 ± 0.8β
|
57.4 ± 1.3de
|
64.5 ± 1.0bc
|
|
|
High school |
63.6 ± 0.6β
|
59.6 ± 1.1de
|
67.1 ± 0.7ab
|
|
|
≥ College |
67.1 ± 0.7α
|
64.5 ± 1.0bc
|
69.7 ± 0.8a
|
|
Household income |
|
< 0.001 |
|
|
< 0.001 |
|
|
Q1 (lowest) |
58.5 ± 0.7γ
|
54.5 ± 1.1e
|
62.2 ± 0.8cd
|
|
|
Q2 |
61.6 ± 0.7β
|
58.8 ± 1.1ed
|
64.3 ± 0.8bc
|
|
|
Q3 |
64.2 ± 0.7α
|
63.5 ± 1.3bcd
|
65.7 ± 0.8ab
|
|
|
Q4 (highest) |
66.1 ± 0.7α
|
63.6 ± 1.1bcd
|
68.6 ± 0.8a
|
|
Occupation |
|
< 0.001 |
|
|
< 0.001 |
|
|
White collar |
65.9 ± 0.9α
|
63.9 ± 1.3abc
|
67.7 ± 1.2a
|
|
|
Pink collar |
60.9 ± 1.1β
|
58.3 ± 2.3bcd
|
63.5 ± 1.2abc
|
|
|
Blue collar |
60.9 ± 0.7β
|
57.8 ± 1.0d
|
64.0 ± 1.0abc
|
|
|
Unemployed |
62.9 ± 0.5β
|
60.2 ± 0.9cd
|
65.5 ± 0.5ab
|
|
The benefit of national basic livelihood |
|
< 0.001 |
|
|
< 0.001 |
|
|
Yes |
58.2 ± 1.2 |
53.1 ± 1.8c
|
62.2 ± 1.5ab
|
|
|
No |
63.1 ± 0.4 |
60.9 ± 0.6b
|
65.5 ± 0.4a
|
|
Health and diet behavioral factors |
|
|
|
|
|
|
Alcohol drinking |
|
0.843 |
|
|
< 0.001 |
|
|
Yes |
62.8 ± 0.4 |
60.4 ± 0.6b
|
65.1 ± 0.5a
|
|
|
No |
62.9 ± 0.8 |
59.0 ± 1.7b
|
65.6 ± 0.8a
|
|
Smoking |
|
0.015 |
|
|
< 0.001 |
|
|
Never |
63.8 ± 0.6α
|
61.4 ± 1.5ab
|
65.5 ± 0.4a
|
|
|
Former |
62.4 ± 0.8αβ
|
60.8 ± 0.7b
|
63.2 ± 1.9ab
|
|
|
Current |
59.0 ± 1.4β
|
57.7 ± 1.6b
|
59.3 ± 2.8ab
|
|
High physical activity |
|
0.001 |
|
|
< 0.001 |
|
|
Yes |
64.2 ± 0.6 |
61.7 ± 1.0bc
|
66.6 ± 0.6a
|
|
|
No |
61.8 ± 0.4 |
59.3 ± 0.7c
|
64.3 ± 0.5b
|
|
Sleep duration (hr) |
|
0.024 |
|
|
< 0.001 |
|
|
Short (< 7) |
62.9 ± 0.6α
|
60.6 ± 0.9b
|
65.3 ± 0.7a
|
|
|
Normal (7–9) |
63.3 ± 0.5α
|
61.0 ± 0.9b
|
65.5 ± 0.6a
|
|
|
Long (> 9) |
57.2 ± 2.2β
|
52.9 ± 3.0b
|
62.6 ± 2.5ab
|
|
Nutrition labeling awareness |
|
< 0.001 |
|
|
< 0.001 |
|
|
Yes |
64.4 ± 0.5 |
62.4 ± 0.8b
|
66.6 ± 0.5a
|
|
|
No |
59.4 ± 0.6 |
56.8 ± 0.9c
|
61.9 ± 0.8b
|
|
Nutritional education and counseling |
|
0.068 |
|
|
< 0.001 |
|
|
Yes |
64.5 ± 1.0 |
60.1 ± 1.6c
|
68.3 ± 1.2a
|
|
|
No |
62.6 ± 0.4 |
60.4 ± 0.6c
|
64.9 ± 0.4b
|
|
Eating with family |
|
0.225 |
|
|
< 0.001 |
|
|
Yes |
63.1 ± 0.4 |
60.7 ± 0.7b
|
65.5 ± 0.4a
|
|
|
No |
61.9 ± 1.0 |
58.0 ± 1.6b
|
65.1 ± 1.1a
|
|
Food security |
|
< 0.001 |
62.4 ± 0.7b
|
66.6 ± 0.5a
|
< 0.001 |
|
|
Yes |
64.4 ± 0.4 |
58.0 ± 0.9c
|
63.7 ± 0.6b
|
|
|
No |
61.0 ± 0.5 |
|
|
|
Eating out (/w) |
|
0.881 |
|
|
< 0.001 |
|
|
High (≥ 3) |
62.8 ± 0.6 |
60.6 ± 1.0b
|
65.1 ± 0.7a
|
|
|
Low (≤ 2) |
62.7 ± 0.4 |
60.1 ± 0.7b
|
65.3 ± 0.5a
|
|
Supplement use |
|
< 0.001 |
|
|
< 0.001 |
|
|
Yes |
65.0 ± 0.5 |
63.0 ± 0.9b
|
67.0 ± 0.5a
|
|
|
No |
60.1 ± 0.5 |
58.0 ± 0.8c
|
62.3 ± 0.6b
|
|
On diet therapy |
|
0.004 |
|
|
< 0.001 |
|
|
Yes |
64.1 ± 0.6 |
62.1 ± 1.0bc
|
66.3 ± 0.7a
|
|
|
No |
62.1 ± 0.4 |
59.4 ± 0.7c
|
64.7 ± 0.5ab
|
|
Water drinking (mL/day) |
|
< 0.001 |
|
|
< 0.001 |
|
|
High (≥ 962) |
63.9 ± 0.5 |
61.0 ± 0.8c
|
66.6 ± 0.6a
|
|
|
Low (< 962) |
61.5 ± 0.5 |
59.6 ± 0.9c
|
63.7 ± 0.5b
|
|
Health status factors |
|
|
|
|
|
|
Self-reported health status |
63.9 ± 0.8 |
0.097 |
61.4 ± 1.2b
|
66.4 ± 0.9a
|
< 0.001 |
|
|
Good to very good |
62.5 ± 0.4 |
59.9 ± 0.7b
|
65.0 ± 0.4a
|
|
|
Very bad to medium |
|
|
|
|
Self-reported chronic disease |
|
0.046 |
60.3 ± 0.9b
|
64.5 ± 0.6a
|
< 0.001 |
|
|
Yes |
62.4 ± 0.5 |
61.1 ± 1.0b
|
66.7 ± 0.7a
|
|
|
No |
64.1 ± 0.6 |
|
|
|
Limitation of activities |
|
< 0.001 |
|
|
< 0.001 |
|
|
Yes |
60.0 ± 0.8 |
57.9 ± 1.3b
|
62.2 ± 1.0b
|
|
|
No |
63.3 ± 0.4 |
60.8 ± 0.7b
|
65.8 ± 0.4a
|
|
Perceived poor oral health |
|
< 0.001 |
|
|
< 0.001 |
|
|
Yes |
60.9 ± 0.7 |
58.4 ± 1.1c
|
63.3 ± 0.8b
|
|
|
No |
63.7 ± 0.4 |
61.4 ± 0.7bc
|
66.1 ± 0.5a
|
|
Perceived stress |
|
< 0.001 |
|
|
< 0.001 |
|
|
Yes |
60.0 ± 0.8 |
56.7 ± 1.5c
|
62.9 ± 0.8b
|
|
|
No |
63.5 ± 0.4 |
61.2 ± 0.6b
|
65.9 ± 0.5a
|
|
Anthropometric factors |
|
|
|
|
|
|
Body mass index |
|
0.003 |
|
|
< 0.001 |
|
|
Underweight |
62.0 ± 1.7αβ
|
60.2 ± 2.9abc
|
64.1 ± 2.0abc
|
|
|
Normal |
63.7 ± 0.5α
|
60.9 ± 0.9c
|
66.4 ± 0.6a
|
|
|
Overweight |
63.5 ± 0.7α
|
61.7 ± 1.2bc
|
65.5 ± 0.8ab
|
|
|
Obesity |
60.9 ± 0.6β
|
58.5 ± 1.1c
|
63.4 ± 0.8bc
|
|
Waist circumference |
|
0.023 |
|
|
< 0.001 |
|
|
≥ 90 cm (male)/85 cm (female) |
61.6 ± 0.6 |
58.8 ± 1.0b
|
64.3 ± 0.8a
|
|
|
< 90 cm (male)/85 cm (female) |
63.3 ± 0.4 |
61.0 ± 0.7b
|
65.6 ± 0.5a
|
|
Cancer-related factors |
|
|
|
|
|
|
Type of cancer |
61.8 ± 0.7 |
0.035 |
59.2 ± 1.0b
|
62.7 ± 1.0ab
|
< 0.001 |
|
|
Stomach |
65.7 ± 2.1 |
62.4 ± 2.4ab
|
68.5 ± 4.2ab
|
|
|
Liver |
62.5 ± 1.3 |
59.4 ± 1.5b
|
64.3 ± 2.1ab
|
|
|
Colon |
64.2 ± 0.9 |
- |
66.1 ± 0.9a
|
|
|
Breast |
60.6 ± 1.1 |
- |
62.5 ± 1.1ab
|
|
|
Cervix |
64.7 ± 1.9 |
60.1 ± 2.0ab
|
73.9 ± 4.6ab
|
|
|
Lung |
64.3 ± 0.5 |
61.0 ± 0.9b
|
66.3 ± 0.5a
|
|
|
Other |
|
|
|
|
Years since diagnosis (yr) |
|
0.264 |
|
|
< 0.001 |
|
|
< 2 |
64.1 ± 0.9 |
61.2 ± 1.4ab
|
65.9 ± 1.2a
|
|
|
≥ 2 to < 5 |
63.8 ± 0.6 |
61.3 ± 1.1ab
|
65.3 ± 0.8a
|
|
|
≥ 5 to < 10 |
63.7 ± 0.6 |
60.9 ± 1.1b
|
65.3 ± 0.7a
|
|
|
≥ 10 |
62.3 ± 0.6 |
58.0 ± 1.1b
|
64.8 ± 0.7a
|
|
Number of diagnosed cancers |
|
0.854 |
|
|
< 0.001 |
|
|
1 |
63.4 ± 0.4 |
60.3 ± 0.6b
|
65.2 ± 0.4a
|
|
|
≥ 2 |
63.6 ± 1.3 |
62.0 ± 1.8ab
|
64.4 ± 1.9ab
|
The sex effect on the KHEI scores among cancer survivors
We analyzed the sex effect on the KHEI score adjusted for all thirty potential confounders, showing significantly different KHEI scores between males and females. Male cancer survivors had lower KHEI scores than female cancer survivors by 3.8 points (unstandardized regression coefficient β for males’ KHEI scores versus females = −3.8, SE = 1.2, p value = 0.002). The VIF to assess multicollinearity was < 4.0 (maximum VIF = 3.38).
Factors associated with the KHEI scores by sex among cancer survivors
Table 5 indicates the factors related to KHEI scores in male or female cancer survivors. Fifteen and eight factors were identified as contributing to lower diet quality scores in male and female cancer survivors, respectively (male, adjusted R
2 = 0.25, F-value = 10.15, p value < 0.001; female, adjusted R
2 = 0.12, F-value = 8.32, p value < 0.001). For males, sleep duration, household type, and economic factors (household income, benefit of national basic livelihood, manual occupation, lack of food security) were the main factors contributing to lower diet quality scores that differed from those of females. In females, on the other hand, education (nutritional education, school education), cancer type, and pink-collar jobs were the main factors that differed from those of males. Being an adult before age 64, obesity, and not taking dietary supplements were common factors for lower diet quality scores in both males and females.
Table 5Factors associated with the Korean Healthy Eating Index scores by sex among cancer survivors
Table 5
|
Males |
Females |
|
Factors (reference) |
β*
|
SE |
p value |
Factors (reference) |
β |
SE |
p value |
|
Constant |
82.9 |
3.4 |
< 0.001 |
Constant |
80.4 |
1.9 |
< 0.001 |
|
> 9 hr sleep duration (Ref. 7–9 hr sleep duration) |
−8.6 |
2.6 |
0.001 |
No nutritional education (Ref. Nutritional education) |
−5.5 |
1.5 |
< 0.001 |
|
Non-single household (Ref. Single household) |
−8.1 |
2.6 |
0.002 |
Elementary school graduation (Ref. ≥ College) |
−4.7 |
1.0 |
< 0.001 |
|
Household income Q1 (Ref. Q4) |
−6.6 |
1.6 |
< 0.001 |
No dietary supplement use (Ref. Use) |
−3.9 |
0.8 |
< 0.001 |
|
Living without a spouse (Ref. Living with a spouse) |
−4.9 |
2.2 |
0.027 |
Stomach cancer (Ref. Other cancers) |
−3.1 |
1.4 |
0.025 |
|
Benefit of national basic livelihood (Ref. No) |
−4.7 |
2.4 |
0.046 |
Obesity (Ref. Normal weight) |
−3.0 |
0.9 |
0.001 |
|
19–64 yr (Ref. ≥ 65 yr) |
−4.6 |
1.2 |
< 0.001 |
Cervical cancer (Ref. Other cancers) |
−3.0 |
1.1 |
0.005 |
|
No nutrition labeling awareness (Ref. Awareness) |
−4.3 |
1.1 |
< 0.001 |
Pink collar (Ref. Unemployed) |
−2.8 |
1.3 |
0.026 |
|
Obesity (Ref. Normal weight) |
−3.9 |
1.1 |
0.001 |
19–64 yr (Ref. ≥ 65 yr) |
−2.1 |
1.0 |
0.043 |
|
Household income Q2 (Ref. Q4) |
−3.8 |
1.3 |
0.004 |
|
|
|
|
|
Limitation of activity (Ref. No limitation) |
−3.7 |
1.4 |
0.011 |
|
|
|
|
|
No dietary supplement use (Ref. Use) |
−3.3 |
1.0 |
0.002 |
|
|
|
|
|
Not on diet therapy (Ref. On diet diet therapy) |
−3.3 |
1.1 |
0.002 |
|
|
|
|
|
Blue collar (Ref. Unemployed) |
−3.0 |
1.2 |
0.011 |
|
|
|
|
|
Perceived stress (Ref. No perceived stress) |
−2.7 |
1.4 |
0.047 |
|
|
|
|
|
No food security (Ref. Food security) |
−2.3 |
1.1 |
0.032 |
|
|
|
|
The VIF to check for multicollinearity was < 4.0 (maximum VIF = 2.64 for males and 3.30 for females).
DISCUSSION
We discovered the following results in this large nationwide study. After adjusting for age, the quality of the female cancer survivors' diet is higher than that of the male (p value < 0.001;
Table 3). These higher diet quality scores for females were attributed to higher total and fresh fruit intake and lower sweets/beverage intake than males (
Table 3). All thirty factors considered in our study affected the difference in diet quality scores between males and females (
Table 4). After adjusting these factors, the female cancer survivors’ diet quality score (KHEI score = 84.6) is still higher than the males' (KHEI score = 80.8). Therefore, we discovered that the factor ‘sex’ affected diet quality scores. Finally, based on the above findings, we found that factors associated with lower diet quality scores among cancer survivors differed between males and females. In male cancer survivors, long sleep duration (> 9 hours), non-single household, household income, living without a spouse, the benefit of national basic livelihood, the age of 19–64, nutrition labeling unawareness, obesity, limitation of activity, dietary supplement non-use, no diet therapy, blue-collar job, perceived stress, food insecurity were significant predictors of lower diet quality scores. On the other hand, in female cancer survivors, no nutritional education, elementary school graduation, dietary supplement non-use, stomach or cervical cancer, obesity, pink collar, and the age of 19–64 were factors contributing to lower diet quality scores (
Table 5).
To our knowledge, no previous research has divided cancer survivors into males and females and studied the factors that influence the diet quality of each sex. We therefore reviewed similar previous studies. A study of 242 cancer patients (79 males, 162 females) in the United States reported that a lower education level was associated with lower diet quality scores while being an unemployed homemaker was associated with higher diet quality scores [
18]. This is consistent with the findings for female cancer survivors in this study. However, this previous study reported no difference in diet quality scores between males and females, which is inconsistent with the current study [
18]. This discrepancy could be due to differences in sample size, socio-cultural background, ethnicity, and diet quality assessment tool. Another study, which separated the male and female general population, reported that, only in males, widowhood, previous smoking, and low BMI (< 20 kg/m
2) were associated with lower dietary quality scores [
19]. This finding is inconsistent with our study of cancer survivors. This is thought to be due to the overall changes that a cancer diagnosis brings to an individual's quality of life, limitations in activities of daily living, depression, perceived health, and mental health [
20].
Several possible explanations can be suggested for the differences between males and females in the factors associated with lower diet quality scores. Regarding male cancer survivors, the current study observed an association between longer sleep duration and lower dietary quality scores. It has been reported that longer sleep duration may cause changes in conventional meal patterns and timing and cause snacking instead of eating meals [
21]. Frequent snacking can lead to excessive carbohydrates, fats, and simple sugars and insufficient protein, vegetables, and fruit intake, leading to lower diet quality [
22]. Males are more exposed to this risk. This is because, traditionally, females are more involved in meal preparation in Korea, so males are more likely to lack meal preparation skills. Therefore, males may slip into low-quality snacking more readily than females. In addition, it is also notable that for males, factors related to economic circumstances are more prevalent. Household income affects an individual's nutritional status and health by enabling them to purchase nutritious, high-quality food [
23,
24]. The lowest income groups reported higher intakes of whole milk, meat, meat products, fats, simple sugars, potatoes, and processed cereals and lower intakes of fresh fruits and vegetables than the highest income groups [
25]. In Korea, males are the primary breadwinners [
26], and household income is reported to decrease after a cancer diagnosis [
27]. Therefore, male cancer survivors may be more sensitive to economic factors, which may affect their food purchases and choices and, in turn, be associated with lower diet quality. The fact that male cancer survivors eat out more often than females may also make them more susceptible to economic factors (
Table 1). The finding that male cancer survivors who live alone have higher diet quality scores than those who do not may be interpreted in the same manner. Male cancer survivors with dependents may be more affected by economic factors, leading them to alter their dietary behaviors, such as food choices and eating habits, in ways that could diminish the quality of their diet.
On the other hand, concerning female cancer survivors, education was found to be significantly associated with diet quality scores. Level of schooling is likely to be associated with understanding nutrition-related information, and nutrition education is expected to be linked to desirable nutrition-related behaviors. In particular, females have been reported to have more positive food-related beliefs and attitudes and a greater willingness to change their dietary behavior than males. Therefore, females are thought to be more compliant with recommended dietary behaviors than males [
28]. In this context, it is proposed that nutritional education significantly impacts diet quality scores for female cancer survivors, as they are more likely to apply the information learned from nutritional education compared to males. Additionally, females are more likely to be the primary meal preparers and, therefore, may be more favorable to implement the knowledge gained from nutritional education. In conclusion, nutritional interventions for male cancer survivors may be more effective in improving diet quality if factors such as sleep duration, economic factors, and food preparation skills are considered. On the other hand, when nutrition interventions are targeted at female cancer survivors, it is thought that focusing on nutritional education may be beneficial to improve the quality of their diets.
Our study has some limitations. Firstly, this study is based on cross-sectional data and is inherently limited to infer temporality and causality between diet quality scores and related factors. Secondly, clinical data, such as cancers and chronic diseases, are self-reported. Thus, the potential for reporting bias and misclassification should be considered. Thirdly, the subjects’ dietary intake data by 24-hour recall inherently has limitations in assessing habitual food consumption. Fourthly, although as many factors related to diet quality scores as possible were involved based on prior studies, the effect of unmeasured residual factors should not be overlooked. Fifth, the dietary quality measures used in this study were designed for the general population and must be further tested for reliability and validity in cancer survivors. Finally, the data analyzed in this study were based on Korean populations. While they can be generalized to other Asian populations, they may be limited to different races or ethnicities.
Nevertheless, to our knowledge, the current study is the first to identify the factors associated with lower diet quality scores in cancer survivors rather than non-cancer survivors. Furthermore, our study found that the factors related to diet quality scores differed between male and female cancer survivors. Additionally, we included as many factors as possible from the literature on socio-demographic, health and diet behavioral, health status, anthropometric, and cancer-related factors. Finally, the analysis was conducted on Koreans, so Asian-specific factors were fully reflected.
CONCLUSION
Factors associated with lower diet quality scores are sex-specific. Therefore, when screening for cancer survivors at risk of lower diet quality, considering the male-specific and female-specific factors identified in this study may help to detect them more quickly and accurately. In addition, identifying and focusing on the modifiable sex-specific factors revealed in this study in nutritional interventions such as education may be an effective way to improve the quality of cancer survivors' diets. We hope this research will help improve the quality of cancer survivors' diets, ultimately improving their quality of life and contributing to their survival.
National Research Foundation of Koreahttps://doi.org/10.13039/501100003725
NRF-2018R1D1A1B07045353NRF-2021R1F1A1050847
NOTES
-
Funding: This research was supported by grants from the National Research Foundation of Korea (NRF–2018R1D1A1B07045353; NRF–2021R1F1A1050847).
-
Conflict of Interest: The authors declare that they have no competing interests.
-
Author Contributions:
Conceptualization: Je Y, Jung S.
Data curation: Je Y, Jung S.
Formal analysis: Jung S.
Funding acquisition: Je Y.
Investigation: Je Y, Jung S.
Writing - original draft: Jung S.
Writing - review & editing: Je Y.
SUPPLEMENTARY MATERIAL
Supplementary Table 1
The details of factors related to Korean Healthy Eating Index scores among cancer survivors
cnr-14-41-s001.xls
REFERENCES
- 1. Statistics Korea. Causes of death statistics for 2023. 2024. cited 2025 January 10. Available from https://kostat.go.kr
- 2. Hirayama T. Life-style and cancer: from epidemiological evidence to public behavior change to mortality reduction of target cancers. J Natl Cancer Inst Monogr 1992;65-74.
- 3. Yassibaş E, Arslan P, Yalçin S. Evaluation of dietary and life-style habits of patients with gastric cancer: a case-control study in Turkey. Asian Pac J Cancer Prev 2012;13:2291-2297.
- 4. Flower G, Fritz H, Balneaves LG, Verma S, Skidmore B, et al. Flax and breast cancer: a systematic review. Integr Cancer Ther 2014;13:181-192.
- 5. Freudenheim JL, Marshall JR, Vena JE, Laughlin R, Brasure JR, et al. Premenopausal breast cancer risk and intake of vegetables, fruits, and related nutrients. J Natl Cancer Inst 1996;88:340-348.
- 6. Wu J, Zeng R, Huang J, Li X, Zhang J, et al. Dietary protein sources and incidence of breast cancer: a dose-response meta-analysis of prospective studies. Nutrients 2016;8:730.
- 7. Dandamudi A, Tommie J, Nommsen-Rivers L, Couch S. Dietary patterns and breast cancer risk: a systematic review. Anticancer Res 2018;38:3209-3222.
- 8. Harmon BE, Boushey CJ, Shvetsov YB, Ettienne R, Reedy J, et al. Associations of key diet-quality indexes with mortality in the multiethnic cohort: the dietary patterns methods project. Am J Clin Nutr 2015;101:587-597.
- 9. Milajerdi A, Namazi N, Larijani B, Azadbakht L. The association of dietary quality indices and cancer mortality: a systematic review and meta-analysis of cohort studies. Nutr Cancer 2018;70:1091-1105.
- 10. Reedy J, Krebs-Smith SM, Miller PE, Liese AD, Kahle LL, et al. Higher diet quality is associated with decreased risk of all-cause, cardiovascular disease, and cancer mortality among older adults. J Nutr 2014;144:881-889.
- 11. Chen Y, Kim M, Paye S, Benayoun BA. Sex as a biological variable in nutrition research: from human studies to animal models. Annu Rev Nutr 2022;42:227-250.
- 12. Kiefer I, Rathmanner T, Kunze M. Eating and dieting differences in men and women. J Mens Health Gend 2005;2:194-201.
- 13. Feuerstein M. Defining cancer survivorship. J Cancer Surviv 2007;1:5-7.
- 14. Marzorati C, Riva S, Pravettoni G. Who is a cancer survivor? A systematic review of published definitions. J Cancer Educ 2017;32:228-237.
- 15. Yun S, Park S, Yook SM, Kim K, Shim JE, et al. Development of the Korean healthy eating index for adults, based on the Korea National Health and Nutrition Examination Survey. Nutr Res Pract 2022;16:233-247.
- 16. Yook SM, Park S, Moon HK, Kim K, Shim JE, et al. Development of Korean healthy eating index for adults using the Korea national health and nutrition examination survey data. J Nutr Health 2015;48:419-428.
- 17. Kim S, Yang JH, Park GH. Eating frequency is inversely associated with BMI, waist circumference and the proportion of body fat in Korean adults when diet quality is high, but not when it is low: analysis of the Fourth Korea National Health and Nutrition Examination Survey (KNHANES IV). Br J Nutr 2018;119:918-927.
- 18. Kane K, Ilic S, Paden H, Lustberg M, Grenade C, et al. An evaluation of factors predicting diet quality among cancer patients. Nutrients 2018;10:1019.
- 19. Kang M, Park SY, Shvetsov YB, Wilkens LR, Marchand LL, et al. Sex differences in sociodemographic and lifestyle factors associated with diet quality in a multiethnic population. Nutrition 2019;66:147-152.
- 20. Williams K, Jackson SE, Beeken RJ, Steptoe A, Wardle J. The impact of a cancer diagnosis on health and well-being: a prospective, population-based study. Psychooncology 2016;25:626-632.
- 21. Jansen EC, Prather A, Leung CW. Associations between sleep duration and dietary quality: results from a nationally-representative survey of US adults. Appetite 2020;153:104748.
- 22. Kim S, DeRoo LA, Sandler DP. Eating patterns and nutritional characteristics associated with sleep duration. Public Health Nutr 2011;14:889-895.
- 23. Bowman S. Low economic status is associated with suboptimal intakes of nutritious foods by adults in the National Health and Nutrition Examination Survey 1999–2002. Nutr Res 2007;27:515-523.
- 24. Drewnowski A, Darmon N. Food choices and diet costs: an economic analysis. J Nutr 2005;135:900-904.
- 25. James WPT, Nelson M, Ralph A, Leather S. Socioeconomic determinants of health. The contribution of nutrition to inequalities in health. BMJ 1997;314:1545-1549.
- 26. Ministry of Employment and Labor. Survey report on labor conditions by employment type. 2024. cited 2025 January 12. Available from https://www.index.go.kr
- 27. Lee S, Min I. Dynamic impact of cancer diagnosis on income and medical expenditure: an event study approach. Korean Social Security Studies 2022;38:79-100.
- 28. Turrell G. Determinants of gender differences in dietary behavior. Nutr Res 1997;17:1105-1120.