ABSTRACT
Cataracts are a major cause of visual impairment worldwide, particularly among older adults, with an increasing prevalence due to population aging. Surgery is the primary treatment; however, preventive strategies are crucial for reducing the disease burden. This study aimed to investigate dietary and health-related factors associated with cataract occurrence and develop a predictive model using machine learning. Data were derived from the Korea National Health and Nutrition Examination Survey 2015–2017. The study included 190 women aged 60–79 years: 124 with cataracts and 66 controls. Analyzed variables included sociodemographic, behavioral, chronic disease, and dietary intake factors. After data preprocessing, 4 machine learning algorithms: support vector machine (SVM), random forest (RF), eXtreme gradient boosting, and multilayer perceptron were used. Model performance was evaluated using accuracy, precision, recall, F1-score, and area under the receiver operating characteristic curve (AUROC) and precision-recall curves. Among the tested models, the SVM achieved the best performance under stratified 10-fold cross-validation, with 71% accuracy, 86% precision, 73% recall, 79% F1-score, 65% AUROC, and 81% AUPRC. According to our findings, the odds of having cataracts can be effectively predicted using dietary and health data without relying on specialized ophthalmic equipment. The proposed model demonstrates the potential of machine learning-based tools for early identification and prevention of cataracts. Future studies with larger and more diverse samples, as well as integrating additional data sources such as genomics and lifestyle factors, are warranted to refine predictive accuracy and enhance personalized nutrition-based interventions.
-
Keywords: Cataracts; Machine learning; Korea National Health and Nutrition Examination Survey (KNHANES); Aged
INTRODUCTION
The continuous rise in life expectancy is increasing older population. Unfortunately, a longer life expectancy is often compromised by age-related diseases. According to Statistics Korea, as of 2024, South Korea has become an aged society, with older people accounting for 19.5% of the total population [
1]. This demographic shift highlights the importance of promoting health and well-being throughout the later stages of life [
2].
Maintaining a balanced diet is key for health preservation and disease prevention in older adults [
3]. However, dietary intake and dietary diversity tend to decline with advancing age, which may contribute to the deterioration of nutritional status [
3]. According to the 6
th Korea National Health and Nutrition Examination Survey (KNHANES), energy intake among individuals aged ≥ 65 years frequently are below the estimated energy requirement (EER). Specifically, 54.6% of men and 58.1% of women aged 65–74 years, and 70.0% of men and 72.5% of women aged ≥ 75 years consumed less than the EER. Protein intake was also considered inadequate, with 24.9% of men and 40.1% of women aged 65–74, and 41.1% of men and 55.6% of women aged ≥ 75 years falling short of the recommended dietary allowance. Similarly, intake of micronutrients, including riboflavin, vitamin A, and calcium, was below the estimated average requirement. In contrast, only 13% of older adults had an adequate sodium intake, most having an excessive intake [
4]. This nutritional imbalance worsens with advancing age and has been strongly associated with ocular diseases that significantly affect quality of life in older adults [
5,
6]. Cataracts, a representative age-related degenerative eye disease, is characterized by clouding of the natural lens, resulting in impaired vision and, in severe cases, blindness [
1]. According to the World Health Organization, cataracts account for 42% of global visual impairment cases and 39% in Asian populations, including South Korea. Among age-related eye conditions, approximately 50% of diagnoses in older adults are cataracts [
7]. According to the National Institutes of Health, the prevalence of cataracts increases significantly after the age of 40, with approximately 70% of Americans being affected by the age of 80 [
8]. Data from Korea’s Health Insurance Review & Assessment Service (2015–2018) showed an 8.6% increase in diagnoses of senile cataract within that timeframe, thereby making it the leading cause of hospital admissions among the elderly during this period [
9]. Similarly, the National Health Insurance Service’s 2018 “Major Surgery Statistics” reported an annual increase of 5.2% in cataract surgeries, indicating a sustained increase in prevalence driven by population aging [
10].
Cataract development has been associated with a range of risk factors, including advanced age, sex, exposure to ultraviolet radiation, alcohol intake, smoking status, elevated body mass index (BMI), and chronic diseases such as hypertension and diabetes. In addition, dietary factors may contribute to the development of cataracts [
11,
12].
Currently, surgical intervention, particularly intraocular lens implantation, is the primary treatment for cataracts. However, due to factors such as lack of awareness, socioeconomic barriers, and fear of vision loss, many elderly individuals do not undergo surgery at the appropriate time, leading to increased vision impairment and blindness [
11].
Currently, machine learning (ML)—a subfield of artificial intelligence (AI)—has the potential to produce accurate and rapid data-driven predictions. In fact, ML has demonstrated outstanding performance in various medical prediction problems [
13]. Cho et al. [
14] suggested that ML-based predictive modeling could shift the healthcare paradigm from treatment to prevention and follow-up management, thereby enabling personalized healthcare, reducing societal costs, and improving the quality of life in aging populations. For instance, Shin and Lee [
15] used classification and regression trees to identify successful aging factors, while Austin et al. [
16] employed ensemble methods to predict cardiovascular mortality. Similarly, Son et al. [
17] developed a support vector machine (SVM) model to forecast medication adherence in heart failure patients and Bang et al. [
18] built a dementia diagnostic model based on approximately 480 clinical variables including medical records, caregiver interviews, and cognitive assessments.
According to Thylefors et al. [
6], delaying the onset of cataracts by just 10 years could reduce cataract surgeries by up to 45%, emphasizing the urgent need for preventive strategies.
In our previous study using data from the 2015–2017 KNHANES [
1], we found significant associations between macronutrient intake and cataract incidence among Korean adults aged ≥ 60 years and older. Building upon these findings, the present study aims to develop an AI-based cataract risk prediction model by applying multiple ML algorithms to address an existing research gap, as few previous studies incorporated dietary factors into ML-based cataract prediction models. The model aims to prompt high-risk individuals to take preventive measures and support low-risk individuals in maintaining healthy diets, helping delay cataract onset. Furthermore, it could become a valuable tool for large-scale disease prediction and public health management.
MATERIALS AND METHODS
Data source and study population
This study utilized integrated data from the 3rd year of the 6th KNHANES (2015) and the 1st–2nd years of the next KNHANES (2016–2017). From a total of 23,657 respondents, 190 women aged 60–79 years were selected for analysis due to superior model performance observed during preliminary analyses.
In our previous study [
1], both men and women aged ≥ 60 years were analyzed (n = 1,619). Here, only women aged 60–79 years were selected due to the higher cataract prevalence and significant sex-specific associations observed previously. Consequently, the control sample size (n = 66) was smaller than that of the cataract group. This sample included 66 women without cataracts (non-cataract group) and 124 women diagnosed with cataracts (cataract group). Based on our previous study [
1], subgroup analyses stratified by sex and age were performed on the entire population.
Health behavior
Smoking status was categorized into 3 groups: never, former and current smoker. Walking frequency was measured by the number of days participants engaged in walking during the previous week, ranging from 0 to 7 days. Daily near-work time, defined as time invested in activities such as reading, writing, or using digital devices (≤ 2 hours, 3 hours, and ≥ 4 hours per day).
Chronic disease factors
The BMI was calculated using participants’ height and weight and classified according to the Korean Obesity Guidelines as follows: underweight (BMI < 18.5 kg/m2), normal weight (BMI, 18.5–22.9 kg/m2), overweight (BMI, 23.0–24.9 kg/m2), and obese (BMI, ≥ 25.0 kg/m2).
Diabetes status was determined based on fasting blood sugar (FBS) levels and clinical diagnosis, and categorized into 3 groups: diabetes mellitus, defined as FBS ≥ 126 mg/dL, physician-diagnosed, or currently under treatment; impaired fasting glucose, defined as FBS of 100–125 mg/dL, and normal for an FBS < 100 mg/dL with no clinical diagnosis.
Sociodemographic factors
Employment status: “Yes” (employed) or “No” (unemployed or economically inactive), based on KNHANES interview data.
Health examination variables
HbA1c: included as a clinical indicator of glycemic control.
Dietary intake
Data were collected using the 24-hours dietary recall method by trained interviewers.
Food consumption was assessed using volume/weight conversions and standardized food composition databases. Vegetable and fruit intake were used as key dietary variables.
Nutrient intake classification
Nutrient intake was calculated from 24-hours recall data using national standard databases. Eleven nutrients were selected for analysis: protein, total fat, monounsaturated fatty acids, polyunsaturated fatty acids, saturated fatty acids, carotene, retinol, riboflavin, niacin, calcium, and sodium.
Data preprocessing
Data preprocessing involved transforming raw data into a suitable format for analysis and training ML models [
19] as it is a critical step for enhancing the performance of ML algorithms [
20].
Dummy coding
Dummy coding is used to convert categorical variables into binary format for inclusion in linear models. It involves creating n-1 dummy variables for a categorical variable with n levels, with the omitted category serving as reference group. This enables interpretation of effects relative to the baseline category. However, direct interpretation from regression coefficients requires caution [
20].
Robust scaler
Scaling is essential when dealing with variables measured on different scales. The robust scaler was selected in this study as it minimizes the influence of outliers more effectively than standard normalization techniques [
21].
Stratified cross-validation
Unlike traditional hold-out methods (e.g., 80:20 or 70:30 splits), k-fold cross-validation provides more robust performance estimates by splitting the dataset into k subsets (folds). The model is trained on k-folds and validated on the remaining fold, repeating the process k times. However, imbalanced data can lead to skewed validation. To address this, a stratified k-fold cross-validation was used to preserve class proportions in each fold, leading to more reliable performance assessments [
22].
The cataract prediction model was developed using variables derived from KNHANES. Data were divided into training and test sets using stratified random sampling with a 70:30 ratio. Model development was performed in Python 3 (Jupyter Notebook version 6.0.3; Python Software Foundation, Beaverton, OR, USA).
To determine optimal hyperparameters, grid search cross-validation (Grid Search CV) was employed (
Table 1). Four ML algorithms were implemented and compared:
Table 1Machine learning algorithms and hyperparameter settings
Table 1
|
Method |
Class (Package) |
Parameter |
|
SVM |
SVC (scikit-learn) |
C: 100, kernel: rbf, gamma: 0.1, Optimizer: grid search CV |
|
RF |
Random Forest Classifier (scikit-learn) |
N-estimators: 300, Bootstrap: True, Random state: 45, Max features: 10, Max depth: 5, Optimizer: grid search CV |
|
XGB |
XGBClassifier (xgboost) |
Booster: gbtree, Colsample_bytree: 0.6, Max depth: 5, Min child weight: 7, Gamma: 1, Sub sample: 0.6 |
|
MLP |
Multiple-layer perceptron |
Activation: logistic, solver: adam, learning rate: constant, random state: 45, max_iter: 10,000, hidden layer sizes: 600,200 |
Model performance was evaluated using a confusion matrix, and the following metrics were calculated: accuracy, sensitivity (recall), precision, and F1-score. For overall model performance, the area under the receiver operating characteristic curve (AUROC) and area under the precision-recall curve (AUPRC) were used.
RESULTS
Characteristics of the Study Participants
The general characteristics of the study participants are summarized in
Table 2. A total of 190 women aged 60 to 79 years were included in the analysis, comprising 66 individuals in the normal group and 124 in the cataract group. The mean age was 74.0 years in the normal group and 71.9 years in the cataract group.
Table 2General characteristics of participants with or without cataracts
Table 2
|
Variables |
Normal (n = 66) |
Cataract (n = 124) |
p value*
|
|
Age (yr) |
74.0 ± 0.6 |
71.9 ± 0.5 |
0.986 |
|
Smoking status |
|
|
0.098 |
|
Nonsmoker |
61 (92.4) |
121 (97.6) |
|
Ex-smoker |
4 (6.1) |
1 (0.8) |
|
Current smoker |
1 (1.5) |
2 (1.6) |
|
Obesity |
|
|
0.279 |
|
Low weight |
2 (3.0) |
5 (4.0) |
|
Normal |
17 (25.8) |
38 (30.6) |
|
Preobesity |
13 (19.7) |
35 (28.2) |
|
Obesity |
34 (51.5) |
46 (37.1) |
|
Personal economic activity status |
|
|
0.987 |
|
Yes |
20 (30.3) |
36 (29.0) |
|
No |
46 (69.7) |
88 (71.0) |
|
Close distance working time |
|
|
0.186 |
|
< 2 hr |
49 (74.2) |
102 (82.3) |
|
3 hr |
7 (10.6) |
5 (4.0) |
|
> 4 hr |
10 (15.2) |
17 (13.7) |
|
No. of walks in 7 days |
|
|
0.809 |
|
Never |
20 (30.3) |
28 (22.6) |
|
1 day |
5 (7.6) |
6 (4.8) |
|
2 day |
5 (7.6) |
16 (12.9) |
|
3 day |
6 (9.1) |
14 (11.3) |
|
4 day |
5 (7.6) |
7 (5.6) |
|
5 day |
6 (9.1) |
16 (12.9) |
|
6 day |
3 (4.5) |
5 (4.0) |
|
7 day (everyday) |
16 (24.2) |
32 (25.8) |
|
DM |
|
|
0.997 |
|
Normal |
29 (43.9) |
54 (43.5) |
|
IFG |
22 (33.3) |
42 (33.9) |
|
DM |
15 (22.7) |
28 (22.6) |
In terms of smoking, most participants were nonsmokers (92.4% in the normal group and 97.6% in the cataract group). Regarding obesity, 51.5% of participants in the normal group and 37.1% in the cataract group were classified as obese.
With respect to employment status, 30.3% of participants in the normal group and 29% in the cataract group reported being currently employed. Concerning near-work duration, 74.2% of women in the normal group and 82.3% in the cataract group reported engaging in near-work for ≤ 2 hours per day.
As for diabetes status, 43.9% of participants in the normal group and 43.5% in the cataract group were categorized as normal, while 22.7% and 22.6% of participants in the respective groups were considered to have diabetes.
Model validation and evaluation
SVM
The cataract prediction model was developed using a SVM. A Grid Search CV was used to determine the optimal hyperparameters (
Table 1). The SVM model achieved 67% accuracy on the training set and 65% accuracy on the test set. The confusion matrix for different random states is provided for reference. In a confusion matrix, the rows indicate predicted values, and the columns actual values.
Detailed performance metrics for the SVM model are shown in
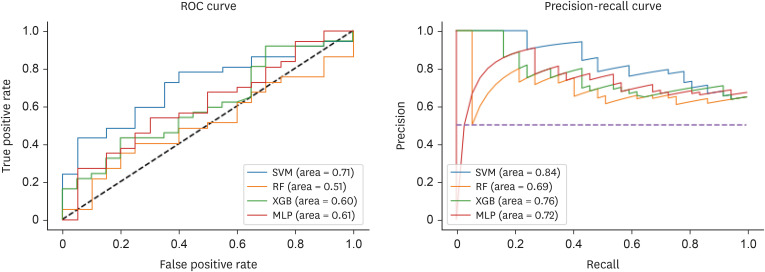
Table 3. The test accuracy was 65%, sensitivity (recall) was 81%, precision was 70%, and the F1-score was 75%. The AUROC and AUPRC were 71% and 84%, respectively. Under stratified 10-fold cross-validation, the model achieved an overall accuracy of 71%, sensitivity of 86%, precision of 73%, and F1-score of 79%. The AUROC and AUPRC for the cross-validation results were 65% and 81%, respectively (
Table 3,
Figure 1).
Table 3Comparison of model performance for cataract prediction
Table 3
|
Metric |
SVM |
RF |
XGB |
MLP |
|
Test |
|
|
|
|
|
Accuracy |
0.65
|
0.56 |
0.63 |
0.63 |
|
Precision |
0.81
|
0.87 |
0.81 |
0.84 |
|
Recall |
0.70
|
0.62 |
0.68 |
0.67 |
|
F1-score |
0.75
|
0.72 |
0.74 |
0.75 |
|
AUROC |
0.71
|
0.51 |
0.61 |
0.61 |
|
AUPRC |
0.84
|
0.69 |
0.79 |
0.72 |
|
CV |
|
|
|
|
|
Accuracy |
0.71
|
0.67 |
0.64 |
0.68 |
|
Precision |
0.86
|
0.78 |
1.00 |
0.68 |
|
Recall |
0.73
|
0.64 |
0.65 |
0.66 |
|
F1-score |
0.79
|
0.71 |
0.79 |
0.67 |
|
AUROC |
0.65
|
0.54 |
0.49 |
0.63 |
|
AUPRC |
0.81
|
0.76 |
0.75 |
0.81 |
Figure 1
ROC and precision–recall curves for the 4 prediction models.
ROC, receiver operating characteristic curve; SVM, support vector machine; RF, random forest; XGB, eXtreme gradient boosting; MLP, multilayer perceptron.

Multilayer perceptron
The cataract prediction model was also constructed using a MLP with hyperparameters optimized via Grid Search CV (
Table 1).
The MLP model achieved 72% accuracy on the training set and 63% on the test set (
Table 3). Confusion matrices for different random states are presented in
Table 3. As in classification problems generally, confusion matrices display predicted values in rows and actual values in columns. As shown in
Table 3, the model’s performance on the test set was as follows: accuracy, 63%; sensitivity, 84%; precision, 67%; and F1-score, 75%. The AUROC and AUPRC were 61% and 72%, respectively. Under stratified 10-fold cross-validation, the MLP achieved 68% accuracy, 68% sensitivity, 66% precision, and an F1-score of 67%. The AUROC and AUPRC were 63% and 81%, respectively (
Table 3,
Figure 1).
Cataract prediction probability and model comparison
Table 4 presents the predicted probability of cataract occurrence for women aged 60–79 years. Among the 4 algorithms tested, the SVM demonstrated the highest overall performance based on stratified 10-fold cross-validation, making it the most effective classifier for cataract prediction in this study population. The model achieved an accuracy of 71%, F1-score of 79%, AUROC of 65%, and AUPRC of 81%.
Table 4Predicted probability (%) of cataract incidence
Table 4
|
Prediction |
SVM |
RF |
XGB |
MLP |
|
1 |
0.62 |
0.64 |
0.77 |
0.87 |
|
2 |
0.63 |
0.74 |
0.72 |
0.58 |
|
3 |
0.56 |
0.70 |
0.58 |
0.19 |
|
4 |
0.77 |
0.73 |
0.85 |
0.51 |
|
5 |
0.51 |
0.59 |
0.80 |
0.52 |
|
6 |
0.66 |
0.64 |
0.44 |
0.65 |
|
7 |
0.59 |
0.60 |
0.64 |
0.69 |
|
8 |
0.66 |
0.87 |
0.88 |
0.83 |
|
9 |
0.55 |
0.73 |
0.81 |
0.85 |
|
10 |
0.64 |
0.74 |
0.73 |
0.94 |
In contrast, the RF and XGB models exhibited slightly higher accuracy on the training data but tended to overfit the small and imbalanced dataset. Similarly, although the MLP model demonstrated potential for nonlinear feature learning, it showed unstable convergence due to the limited sample size.
These differences highlight the varying adaptability of each algorithm to the characteristics of KNHANES-derived health data.
Practical application
Based on the present results, we propose a practical system for the prediction of developing cataracts (
Figure 2). This system may utilize data gathered from simple screening procedures and nutritional questionnaires, as well as from structured sources such as personal health records and electronic medical records. Additionally, 24-hours dietary recall surveys may be used to construct a relevant feature set for model-based prediction and risk analysis.
Figure 2
Proposed architecture of the cataract risk prediction system.
S/W, software.
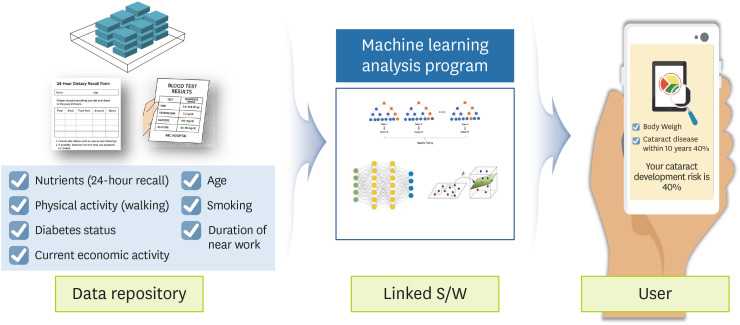
Once the feature set is established, an ML algorithm can be used to evaluate individual risk of developing cataracts. Those identified as high-risk could receive real-time notifications of their risk level, together with tailored health promoting strategies to encourage preventive behaviors.
Moreover, data on interventions and outcomes for individuals in the cataract risk group can be stored in personal health record or electronic medial record systems. This enables continuous and dynamic risk assessment and, through a cyclical feedback system, allows for real-time monitoring and early detection of cataract development.
DISCUSSION
With advancements in science, technology, and medicine contributing to increased life expectancy, the global prevalence of cataracts is rising annually—along with corresponding increases in visual impairment and blindness. Among older adults, who are especially vulnerable to nutritional deficiencies, cataracts have been shown to be closely associated with mortality [
23,
24], making them a critical issue in aging societies. Although recent studies have begun incorporating ML techniques, research exploring the relationship between nutrient intake and cataracts remains limited. This study aimed to identify dietary and health-related risk factors for cataract occurrence in women aged 60–79 and develop a predictive model using nationally representative data from the KNHANES.
The average age of participants in this study was 74.0 years in the non-cataract group and 71.9 years in the cataract group. Hwang [
25] reported that cataract prevalence increases sharply for people in their 70s, reaching 93.8%, while Lee et al. [
26] reported an average onset age of 71.3 years for men and 70.4 years for women—findings consistent with the current study. In addition, Lim [
27] emphasized that health conditions in midlife affect not only longevity but also the quality of life in older age. Given the impact of cataracts on functional health and independence, delaying their onset from midlife should be a key public health focus.
Among the 4 models tested, the SVM demonstrated superior performance with an accuracy of 71%, F1-score of 79%, AUROC of 65%, and AUPRC of 81%. In addition, it demonstrated the most stable and interpretable performance across evaluation metrics. Further, the kernel-based margin optimization of SVM effectively captured nonlinear associations between nutritional variables and cataract incidence while minimizing overfitting.
In contrast, ensemble models such as RF and XGB, though powerful for large-scale datasets, were prone to overfitting in the current small-sample setting due to their complex structure and multiple decision layers. However, the MLP model, while theoretically capable of capturing intricate feature interactions, requires a larger sample size for stable convergence. These findings suggest that margin-based classifiers like SVM may be more suitable for high-dimensional yet limited health datasets such as those in KNHANES.
Therefore, SVM was selected as the final predictive model due to its superior generalization ability and practical interpretability, which make it particularly useful for preventive health applications.
As societies age, interest in personal health has grown significantly. Technological advancements, particularly in information and communication technology, have fueled the development of user-friendly tools such as online self-assessment systems [
28]. In countries like the United States and the United Kingdom, self-diagnosis platforms are not only accessible to the general public but are also used by clinicians as diagnostic aids. For instance, the American Academy of Family Physicians symptom checker enables users to input symptoms and receive potential diagnoses [
29]. In the UK, Farmer et al. [
30] reported approximately 70% diagnostic accuracy using their self-assessment system. These examples underscore the increasing integration of AI-based systems into both clinical practice and public health.
Diagnosing cataracts typically requires a range of clinical tests, including visual acuity assessments, slit-lamp examinations, intraocular pressure measurements, and imaging. However, the predictive model developed here effectively estimated cataract risk using only health screening and dietary data. This suggests that such models may become scalable, low-cost tools for identifying high-risk individuals without the need for specialized equipment.
In conclusion, the present findings highlight the potential utility of the proposed ML model in facilitating early identification and prevention of cataracts. It may also contribute to public health research by providing a foundational approach for developing AI-driven disease prediction systems. Nonetheless, several limitations must be acknowledged. This study had a relatively small-sample size, and ML models inherently face challenges in explaining causal relationships between variables. Additionally, the 24-hours dietary recall method used may not accurately represent long-term dietary habits, which limits the generalizability of the findings. Nonetheless, our results demonstrated the feasibility of predicting cataract risk using only dietary and screening data. By integrating larger and more diverse datasets in future research, comparable predictive models may be applicable to populations beyond the 60–79 age group. Moreover, integrating additional data sources—such as genomic profiles, microbiome data, physical activity patterns, and medication use—may enable the development of more robust, personalized, and accurate models for cataract prediction.
NOTES
-
Conflict of Interest: The authors declare that they have no competing interests.
Eunju Park has edited the CNR since January 2021. However, he was not involved in the peer review process or decision-making. Otherwise, no potential conflict of interest relevant to this article was reported.
-
Author Contributions:
Conceptualization: Park E, Choi J.
Data curation: Choi J.
Formal analysis: Choi J.
Investigation: Choi J.
Methodology: Choi J.
Project administration: Park E, Choi J.
Resources: Choi J.
Software: Choi J.
Supervision: Park E.
Validation: Choi J.
Visualization: Park E, Choi J.
Writing - original draft: Choi J.
Writing - review & editing: Park E, Choi J.
REFERENCES
- 1. Choi J, Park E. Macronutrient intake and cataract incidence among Koreans aged 60 and older: a cross-sectional study using 2015–2017 Korea National Health and Nutrition Examination Survey data. Clin Nutr Res 2025;14:204-215.
- 2. Lee LH. Associations between dietary intake and health status in Korean elderly population. J Nutr Health 2002;35:124-136.
- 3. Kim EM, Choi MK. An analysis of food consumption patterns of the elderly from the Korea national health and nutrition examination survey (KNHANES V-1). J Korean Soc Food Sci Nutr 2013;42:818-827.
- 4. Han GS, Yang EJ. Evaluation of dietary habit and nutritional intake of Korean elderly: data from Korea National Health and Nutrition Examination Survey 2013–2015. J East Asian Soc Diet Life 2018;28:258-271.
- 5. Lee JS. Risk factors of dietary intake affecting cataract [master’s thesis]. Seoul: Ewha Womans University; 2009.
- 6. Thylefors B, Négrel AD, Pararajasegaram R, Dadzie KY. Global data on blindness. Bull World Health Organ 1995;73:115-121.
- 7. World Health Organization (WHO). Blindness and vision impairment. Universal eye health: a global action plan 2014-2019. 2013. cited 2020 June 6. Available from: https://www.who.int/publications/i/item/universal-eye-health-a-global-action-plan-2014-2019
- 8. National Institutes of Health (US). Eye health data and statistics. 2024. cited 2020 June 6. Available from: https://www.nei.nih.gov/learn-about-eye-health/resources-for-health-educators/eye-health-data-and-statistics/cataract-data-and-statistics
- 9. Health Insurance Review & Assessment Service (HIRA). Health care cost statistical indicators (2015–2018). Wonju: HIRA; 2019.
- 10. National Health Insurance Corporation (NHIC). 2018 surgical statistics. Wonju: NHIC; 2018.
- 11. Rim HT, Woo YJ, Park HJ, Kim SS. The epidemiologic survey committee in the Korean ophthalmological society. Current status and future expectations of cataract surgery in Korea: KNHANES IV. J Korean Ophthalmol Soc 2014;55:1772-1778.
- 12. Kim JS, Lee SM, Kang JH, Ahn HS. Intakes of antioxidant nutrients and carotenoids according to lens turbidity level among adults visiting cataract clinic. Korean J Community Nutr 2012;17:205-214.
- 13. Jung JH. Designing policies using machine learning. J Public Finance 2019;279:12-35.
- 14. Cho KH, Lee JW, Kim DW, Kim JK, Seo YS, et al. Research and development of personalized integrated health care program. Goyang: National Health Insurance, Ilsan Hospital Research Institute; 2017.
- 15. Shin YH, Lee HJ. Factors associated with successful aging of Korean older people living in a city. J Korean Gerontol Soc 2009;29:1327-1340.
- 16. Austin PC, Lee DS, Steyerberg EW, Tu JV. Regression trees for predicting mortality in patients with cardiovascular disease: what improvement is achieved by using ensemble-based methods? Biom J 2012;54:657-673.
- 17. Son YJ, Kim HG, Kim EH, Choi S, Lee SK. Application of support vector machine for prediction of medication adherence in heart failure patients. Healthc Inform Res 2010;16:253-259.
- 18. Bang SJ, Son SJ, Hong CH, Shin JH. Tri-phase data mining modeling for dementia diagnosis. J Korean Inst Ind Eng 2016;42:1965-1990.
- 19. Lee HT. Analysis of factors influencing berthing velocity of ship using machine learning prediction algorithm [master’s thesis]. Busan: Korea Maritime and Ocean University; 2019.
- 20. Lee HG, Kim GH. Landslide risk assessment in Inje using logistic regression model. J Korean Soc Surv Geod Photogramm Cartogr 2012;30:313-321.
- 21. Han J, Pei J, Kamber M. Data mining: concepts and techniques. Amsterdam: Elsevier; 2012.
- 22. Heo BM. Predictive model of hypertension and pre-hypertension in Korean middle-aged adults based on data mining [dissertation]. Cheongju: Chungbuk National University; 2018.
- 23. Reidy A, Minassian DC, Desai P, Vafidis G, Joseph J, et al. Increased mortality in women with cataract: a population based follow up of the North London Eye Study. Br J Ophthalmol 2002;86:424-428.
- 24. McGwin G Jr, Owsley C, Gauthreaux S. The association between cataract and mortality among older adults. Ophthalmic Epidemiol 2003;10:107-119.
- 25. Hwang HK. Relationship between metabolic syndrome and ophthalmic health in Korean adults – Based on the 5th Korea National Health and Nutrition Examination Survey [dissertation]. Daegu: Keimyung University; 2014.
- 26. Lee EK, Choi JH, Heo YR. Intake of fruits and vegetables may modify the risk of cataract in Korean males: data from Korean National Health and Nutrition Examination Survey 2012. J Nutr Health 2018;51:423-432.
- 27. Lim HJ. The correlation between health condition and preparation for the old-aged in the middle-aged [master’s thesis]. Seoul: Yonsei University; 2003.
- 28. Kim YJ. Prediction of disease risk and web interface using correlated health indexes [master’s thesis]. Seoul: Seoul National University; 2018.
- 29. American Academy of Family Physicians (AAFP). FamilyDoctor symptom checker. c2025. cited 2020 October 6. Available from: http://familydoctor.org/familydoctor/en/health-tools/search-by-symptom.html
- 30. Farmer SE, Bernardotto M, Singh V. How good is internet self-diagnosis of ENT symptoms using Boots WebMD symptom checker? Clin Otolaryngol 2011;36:517-518.