ABSTRACT
The relationship between vitamin D status and visceral adiposity among older adults remains unclear. This study aimed to investigate the association between serum vitamin D levels and visceral adipose tissue (VAT) among older Iranian adults. This cross-sectional study included older adults aged ≥ 60 years from the Amirkola Health and Aging Project. Serum 25-hydroxyvitamin D levels were measured by enzyme-linked immunosorbent assay. VAT was assessed using dual-energy X-ray absorptiometry. Furthermore, the relationship between vitamin D and VAT was examined through multiple linear regression analysis, adjusting for potential confounders. Of the 600 participants, 345 (57.5%) were males and 255 (42.5%) were females. Their mean age was 68.90 ± 6.97 years, and the mean vitamin D level was 60.50 ± 39.45 ng/mL. Serum vitamin D levels showed a weak negative association with VAT mass (β = −0.062, p = 0.012). In both sexes, VAT mass predictors followed a similar pattern. Body mass index (BMI; β = 0.811, p < 0.001) was identified as a strong predictor, while diabetes status exhibited a positive association with VAT mass (β = 0.078, p = 0.002). Serum vitamin D levels appear to have a weak inverse relationship with visceral adiposity in older Iranian adults. BMI was the most robust predictor of VAT. Further longitudinal research is needed to clarify the causal relationship between vitamin D status and visceral adiposity among older adults.
-
Keywords: Vitamin D; Visceral adipose tissue; Aging; Obesity
INTRODUCTION
The older population across several countries has markedly increased in recent years, reflecting a significant transformation of the global demographic landscape. This shift presents a formidable challenge to public health systems worldwide [
1]. In developing countries such as Iran, individuals aged 60 years and above are classified as older adults, according to the World Health Organization (WHO) [
2]. Iran is experiencing a rapid transition in its population age structure, with approximately 14% of its population expected to be over 65 years of age by 2045 [
3].
Among the health concerns affecting older adults, obesity stands out as a critical issue. The WHO reported that in 2016, 39% of adults aged 18 years and over were overweight, and 13% were obese globally [
4]. This trend is particularly pronounced in older adults because of physiological changes and reduced physical activity. Obesity in older adults is associated with numerous comorbidities, significantly impacting their quality of life and healthcare utilization [
5,
6].
Adipose tissue distribution, especially visceral fat accumulation, is of significant concern. Visceral adipose tissue (VAT), located in the abdominal cavity surrounding the vital organs, is metabolically more active than subcutaneous fat and is strongly associated with increased cardiovascular and metabolic risks. Compared with the gynoid pattern, the android pattern of fat distribution, characterized by central obesity, is more closely linked to these health risks [
7,
8,
9].
While traditionally known for its role in calcium homeostasis and bone health, vitamin D is increasingly acknowledged for its pleiotropic effects throughout the body. This nutrient has garnered significant attention in the context of obesity and metabolic health [
10]. Given that the vitamin D receptor and enzymes involved in vitamin D metabolism are expressed in various tissues, including adipose tissue, this vitamin might play a potential regulatory role in fat metabolism and distribution [
11,
12].
The relationship between vitamin D status and obesity is bidirectional and complex. Obesity is associated with lower serum levels of 25-hydroxyvitamin D (25[OH]D), while vitamin D may exhibit protective effects against obesity onset through various mechanisms. The impact of vitamin D on visceral adiposity has increasingly gained research interest; however, reports yield conflicting results [
13,
14].
Given the high prevalence of obesity among older adults and the inconsistent results from previous studies, the relationship between serum vitamin D levels and visceral adiposity needs to be further investigated in this age group. Hence, this study aimed to evaluate this relationship in older adults residing in Amirkola, Iran, to clarify the potential role of vitamin D in metabolic health and body composition in aging.
MATERIALS AND METHODS
Study design and participants
This cross-sectional study serves as the second phase of the Amirkola Health and Ageing Project (AHAP), an ongoing cohort study of older adults in Amirkola, Northern Iran. This study randomly selected 600 participants, who were Amirkola residents aged 60 years and older, from the AHAP cohort.
The inclusion criteria were as follows: aged 60 years or older, living in Amirkola, and had complete data on vitamin D levels and VAT measurements. Those who had incomplete medical records, were diagnosed with heart failure, liver disease, or kidney disease, had a body mass index (BMI) below 18.5 kg/m2, or had recently consumed vitamin D supplements were excluded.
Data collection
Trained personnel collected demographic information, including age and sex, through surveys using standardized questionnaires. During anthropometric measurements, participants wore light clothing and no shoes. Height and weight were measured to the nearest 0.1 cm and 0.1 kg using a wall-mounted stadiometer and a digital scale (Seca, Hamburg, Germany), respectively. BMI was calculated as weight in kilograms divided by height in meters squared. Moreover, waist circumference was measured with a non-elastic tape positioned at the midpoint between the rib cage’s lower border and the iliac crest.
After at least 5 min of rest, blood pressure was measured in the supine position using an automated device (Omron M6 IntelliSense; Omron Healthcare, Kyoto, Japan). A systolic blood pressure ≥ 140 mmHg and/or a diastolic blood pressure ≥ 90 mmHg or the current use of antihypertensive medications defined hypertension.
Information on smoking status, living arrangement (alone or with family), and vitamin D supplement use was obtained through interviews. The validated Persian version of the Physical Activity Scale for the Elderly was used for assessing physical activity [
15].
After an overnight fast of at least 12 hours, fasting blood samples were collected in the morning. Serum 25(OH)D concentrations were measured using an enzyme-linked immunosorbent assay kit (IDS, Boldon, UK) on a Microplate reader RT-2100 C (Rayto Life and Analytical Sciences Co., Ltd., Shenzhen, China). For 25(OH)D, the inter- and intra-assay coefficients of variation were < 10%. Vitamin D status was categorized as deficient (< 20 ng/mL), insufficient (20–29.9 ng/mL), or sufficient (≥ 30 ng/mL).
Serum levels of total cholesterol, high-density lipoprotein cholesterol, low-density lipoprotein cholesterol, and triglycerides were measured using commercially available kits (Pars Azmoon, Tehran, Iran) on an automated analyzer. Fasting plasma glucose ≥ 126 mg/dL on two separate occasions or current use of glucose-lowering medications defined diabetes.
Body composition assessment
VAT was measured by dual-energy X-ray absorptiometry (DXA) on a Hologic Horizon-WI densitometer (Hologic Inc., Waltham, MA, USA). Whole-body DXA scans were conducted according to manufacturer protocols. The android region of interest was the area between the ribs and the pelvis, as automatically defined by the Hologic APEX software (version 4.0). VAT was calculated by subtracting subcutaneous adipose tissue from the total android fat mass. VAT mass (g), VAT volume (cm3), and VAT area (cm2) were subsequently obtained. Total body fat mass was also derived from the DXA scans.
Statistical analysis
All statistical data were analyzed using SPSS version 26 (IBM Corp., Armonk, NY, USA). Two-tailed p values < 0.05 were considered statistically significant. We present continuous variables as mean ± standard deviation, and categorical variables as frequencies and percentages. Continuous variables’ normality was assessed using the Kolmogorov–Smirnov test. Participants were categorized into tertiles based on serum 25(OH)D levels. Furthermore, differences in participant characteristics across vitamin D tertiles were evaluated using one-way analysis of variance for continuous variables and χ2 tests for categorical variables.
The relationship between serum 25(OH)D and VAT measures was examined using Pearson correlation coefficients. The independent association between 25(OH)D and VAT measures was evaluated using multiple linear regression analysis, adjusting for potential confounders such as age, sex, BMI, waist circumference, physical activity, smoking status, and diabetes. To account for potential sex-related differences, analyses were also stratified by sex. Linearity assumption was assessed by visually inspecting scatter plots.
Ethical considerations
The study protocol obtained approval from the Ethics Committee of Babol University of Medical Sciences (approval code: IR.MUBABOL.HRI.REC.1401.049). All participants provided written informed consent before enrollment. The study conformed to the principles of the Declaration of Helsinki. To ensure confidentiality, we de-identified all data before analysis and reported them only in aggregate form.
RESULTS
Participant characteristics
Our study included 600 older adults from the second phase of the AHAP cohort. Among them, 345 (57.5%) were males and 255 (42.5%) were females. Their mean age was 68.90 ± 6.97 years, ranging from 60 to 93 years. The mean serum vitamin D level was 60.50 ± 39.45 ng/mL. Furthermore, 158 (26.3%) had diabetes, and 125 (20.9%) were taking vitamin D supplements.
Vitamin D distribution and associated factors
Vitamin D levels were significantly associated with sex, vitamin D supplementation, and living arrangement (all: p < 0.001). Meanwhile, smoking status and diabetes were not significantly associated with vitamin D tertiles (p = 0.334 and p = 0.211, respectively).
Age showed a significant positive trend across tertiles (p = 0.036), with the highest mean age (69.87 ± 7.40 years) in the third tertile. VAT mass, volume, and area all decreased as the vitamin D levels increased, although these differences were not statistically significant (p = 0.085, p = 0.093, and p = 0.092, respectively). The LDL level had a significantly decreasing trend across tertiles (p = 0.004), with the lowest mean level (99.59 ± 32.43) found in the highest vitamin D tertile. Physical activity scores also significantly differed across tertiles (p = 0.006), with the lowest mean score (94.48 ± 51.51) noted in the highest vitamin D tertile. Variables such as weight, height, BMI, waist circumference, total body fat, blood pressure, other lipid profile markers, and fasting blood glucose showed no significant differences across vitamin D tertiles.
Table 1 presents the distribution of participants across vitamin D tertiles according to various demographic and clinical factors.
Table 1Distribution of older adult participants by study variables across vitamin D tertiles
Table 1
|
Variables |
T1 (≤ 39.61) |
T2 (39.62–65.22) |
T3 (≥ 65.23) |
p value |
|
Nominal qualitative variables |
|
|
|
|
|
Sex |
|
|
|
< 0.001 |
|
|
Male |
109 (31.6) |
139 (40.3) |
97 (28.1) |
|
|
Female |
91 (35.7) |
61 (23.9) |
103 (40.4) |
|
Smoking |
|
|
|
0.334 |
|
|
None |
172 (33.7) |
164 (32.2) |
174 (34.1) |
|
|
Yes |
28 (33.1) |
36 (40.0) |
26 (28.9) |
|
Diabetes mellitus |
|
|
|
0.211 |
|
|
None |
141 (31.9) |
156 (35.3) |
145 (32.8) |
|
|
Yes |
59 (37.3) |
44 (27.8) |
55 (34.8) |
|
Living arrangement |
|
|
|
< 0.001 |
|
|
Alone |
6 (14.6) |
10 (24.4) |
25 (61.0) |
|
|
With family |
194 (34.7) |
190 (34.0) |
175 (31.3) |
|
Quantitative variables |
|
|
|
|
|
Age (yrs) |
68.10 ± 6.90 |
68.72 ± 6.50 |
69.87 ± 7.40 |
0.036 |
|
Weight (kg) |
70.77 ± 12.48 |
71.91 ± 12.38 |
68.81 ± 13.40 |
0.050 |
|
Height (cm) |
158.51 ± 8.52 |
160.24 ± 8.78 |
156.75 ± 8.39 |
0.001 |
|
BMI (kg/m2) |
28.31 ± 4.95 |
28.00 ± 4.44 |
28.10 ± 5.57 |
0.824 |
|
VAT mass (g) |
903.74 ± 344.88 |
865.00 ± 317.88 |
827.00 ± 370.78 |
0.085 |
|
VAT volume (cm3) |
977.06 ± 372.85 |
934.43 ± 344.33 |
895.69 ± 397.88 |
0.093 |
|
VAT surface (cm2) |
187.44 ± 71.54 |
179.27 ± 66.07 |
171.80 ± 76.33 |
0.092 |
|
Waist circumference (cm) |
95.30 ± 12.35 |
94.24 ± 10.72 |
93.52 ± 13.21 |
0.383 |
|
Total fat weight (g) |
28,102.40 ± 8,619.14 |
27,228.26 ± 8,532.22 |
27,462.36 ± 10,119.84 |
0.611 |
|
Systolic blood pressure (mmHg) |
141.54 ± 20.89 |
140.81 ± 21.36 |
137.86 ± 20.21 |
0.176 |
|
Diastolic blood pressure (mmHg) |
82.93 ± 12.27 |
83.37 ± 10.94 |
82.25 ± 11.94 |
0.633 |
|
Triglyceride (mg/dL) |
158.12 ± 98.53 |
140.00 ± 80.74 |
144.60 ± 88.86 |
0.111 |
|
HDL (mg/dL) |
47.31 ± 11.52 |
46.11 ± 12.28 |
48.43 ± 12.74 |
0.165 |
|
LDL (mg/dL) |
109.63 ± 34.35 |
101.53 ± 29.26 |
99.59 ± 32.43 |
0.004 |
|
Cholesterol (mg/dL) |
197.54 ± 50.92 |
187.50 ± 43.66 |
190.38 ± 50.73 |
0.105 |
|
PASE |
108.66 ± 53.82 |
110.78 ± 60.51 |
94.48 ± 51.51 |
0.006 |
Sex-specific associations between vitamin D and visceral adiposity
In males, higher vitamin D levels were significantly associated with lower VAT mass, volume, and area (all: p = 0.022). The highest vitamin D tertile (≥ 65.23 ng/mL) showed a mean VAT mass of 719.08 ± 321.77 g as compared with 834.71 ± 328.98 g in the lowest tertile (≤ 39.61 ng/mL). Females exhibited a similar trend. The highest vitamin D tertile showed slightly lower VAT measures (mass: 928.62 ± 386.34 g) than the lowest tertile (986.42 ± 347.04 g), although these differences were not statistically significant (p > 0.05).
Correlation analysis
The Pearson correlation analysis revealed that vitamin D levels had weak negative correlations with VAT mass (r = −0.064, p = 0.115), VAT volume (r = −0.064, p = 0.119), and VAT area (r = −0.064, p = 0.118), though not statistically significant. Conversely, the total body fat mass strongly correlated with VAT mass (r = 0.804, p < 0.001), VAT volume (r = 0.806, p < 0.001), and VAT area (r = 0.806, p < 0.001).
Table 2 shows the Pearson correlation coefficients between visceral fat, vitamin D, and other variables.
Table 2Pearson correlation coefficients of variables
Table 2
|
Variables |
Age |
Vitamin D |
BMI |
Physical activity |
Total fat mass |
VAT mass |
VAT volume |
VAT area |
Waist circumference |
|
Age |
1 |
|
|
|
|
|
|
|
|
|
Vitamin D |
0.107 |
1 |
|
|
|
|
|
|
|
|
0.009 |
|
|
|
|
|
|
|
|
|
BMI |
−0.203 |
−0.003 |
1 |
|
|
|
|
|
|
|
< 0.001 |
0.946 |
|
|
|
|
|
|
|
|
PASE |
− 0.264 |
−0.125 |
−0.073 |
1 |
|
|
|
|
|
|
< 0.001 |
0.002 |
0.073 |
|
|
|
|
|
|
|
Total fat mass |
−0.213 |
0.995 |
0.894 |
−0.113 |
1 |
|
|
|
|
|
< 0.001 |
< 0.001 |
< 0.001 |
0.006 |
|
|
|
|
|
|
VAT mass |
−0.135 |
−0.064 |
0.795 |
−0.108 |
0.804 |
1 |
|
|
|
|
0.001 |
0.115 |
< 0.001 |
0.008 |
< 0.001 |
|
|
|
|
|
VAT volume |
−0.138 |
−0.064 |
0.796 |
−0.108 |
0.806 |
0.999 |
1 |
|
|
|
0.001 |
0.119 |
< 0.001 |
0.008 |
< 0.001 |
< 0.001 |
|
|
|
|
VAT area |
−0.138 |
−0.064 |
0.796 |
−0.108 |
0.806 |
0.999 |
1.000 |
1 |
|
|
0.001 |
0.118 |
< 0.001 |
0.008 |
< 0.001 |
< 0.001 |
< 0.001 |
|
|
|
Waist circumference |
−0.112 |
−0.050 |
0.850 |
−0.069 |
0.783 |
0.827 |
0.827 |
0.827 |
1 |
|
0.006 |
0.222 |
< 0.001 |
0.092 |
< 0.001 |
< 0.001 |
< 0.001 |
< 0.001 |
|
Sex-specific correlation analysis
In the sex-specific analysis of vitamin D levels and VAT measures, significant associations were observed in males but not in females. In males, vitamin D levels inversely correlated with VAT mass (r = −0.115, p = 0.032), VAT volume (r = −0.115, p = 0.033), and VAT area (r = −0.115, p = 0.033). Females also showed inverse correlations between vitamin D and the VAT parameters (mass: r = −0.078, p = 0.215; volume: r = −0.077, p = 0.218; area: r = −0.078, p = 0.215), but no statistical significance was noted.
Multiple linear regression analysis
Factors influencing VAT mass were identified using multiple linear regression analysis, with VAT mass as the dependent variable. Vitamin D showed a weak negative association with VAT mass (β = −0.062, p = 0.012). Thus, for each unit increase in vitamin D, VAT mass decreased by 0.546 g, indicating a significant relationship. Moreover, sex was negatively associated with VAT mass (β = −0.053, p = 0.045), with females having higher VAT mass than males. Meanwhile, BMI had a positive strong association with VAT mass (β = 0.811, p < 0.001), indicating that for each increase in BMI, VAT mass increased by 56.09 g. Likewise, diabetes mellitus was positively associated with VAT mass (β = 0.078, p = 0.002).
Table 3 enumerates the results of the multiple linear regression analysis regarding the factors affecting VAT mass.
Table 3Multiple linear regression analysis, with visceral adipose tissue mass as the dependent variable
Table 3
|
Variables |
Unstandardized B |
Standardized coefficients β |
95% CI of B |
p value |
|
Lower |
Upper |
|
Vitamin D (ng/mL) |
−0.546 |
−0.062 |
−0.974 |
−0.119 |
0.012 |
|
Age (yr) |
1.979 |
0.040 |
−0.481 |
4.439 |
0.115 |
|
Sex |
−37.289 |
−0.053 |
−73.705 |
−0.872 |
0.045 |
|
BMI (kg/m2) |
56.087 |
0.811 |
52.445 |
59.729 |
< 0.001 |
|
Diabetes mellitus |
61.457 |
0.078 |
23.057 |
99.857 |
0.002 |
Sex-stratified regression analyses
Sex-specific multiple linear regression analyses unveiled that the patterns of VAT mass predictors were similar in both sexes. In males, significant positive associations were observed for BMI (β = 0.787, B = 60.744, p < 0.001) and diabetes status (β = 0.079, B = 61.961, p = 0.018) and a nonsignificant negative association for vitamin D levels (β = −0.050, B = −0.510, p = 0.132).
Similarly, in females, VAT mass showed significant associations with BMI (β = 0.773, B = 52.038, p < 0.001) and diabetes status (β = 0.078, B = 59.138, p = 0.048 and a nonsignificant negative association with vitamin D levels (β = −0.071, B = −0.523, p = 0.078).
Relationship between vitamin D and VAT mass
Figure 1 illustrates the relationship between serum vitamin D levels and VAT mass for all participants. The scatter plot reveals a weak negative correlation between these variables; thus, higher vitamin D levels may be generally associated with lower VAT mass. However, the data considerably vary, and the relationship does not appear to be strong or clearly linear.
Figure 1Relationship between serum vitamin D levels (ng/mL) and visceral adipose tissue mass (g) in older adults living in Amirkola, Iran.
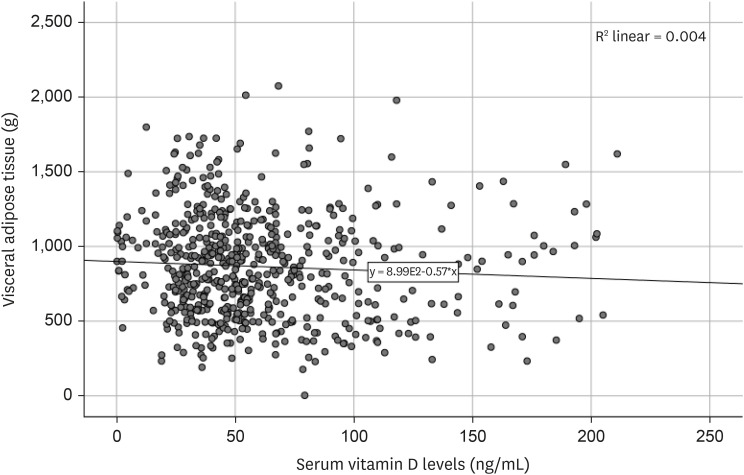
The regression line on the plot demonstrates the overall trend of decreasing VAT mass with increasing vitamin D levels. However, data points are widely scattered around this line, suggesting that other factors, as identified in our regression analyses, play important roles in determining VAT mass.
DISCUSSION
This study investigated the relationship between serum vitamin D levels and VAT among older adults in Amirkola, Iran. Our findings revealed that serum vitamin D levels were negatively associated with VAT mass, volume, and area. Specifically, for every unit increase in vitamin D, VAT mass decreased by 0.546 g, indicating a statistically significant relationship. However, in the sex-specific analysis, this relationship was not significant in either sex.
Our results align with several previous studies reporting inverse relationships between vitamin D levels and total or regional body fat. For instance, Li et al. [
16] found that serum vitamin D levels negatively correlated with VAT among adolescents in the US, particularly in girls, Mexican Americans, and non-Hispanic Whites. Similarly, Ganji et al. [
17] observed that serum 25(OH)D had significant inverse associations with BMI, waist circumference, total fat mass, and android and gynoid fat.
Our study’s crude model demonstrated that, in both sexes, vitamin D levels increased as the VAT decreased. However, this effect was diminished in the adjusted model, suggesting that some other factors are implicated in the association between vitamin D and VAT, consistent with other studies. Kim and Cho [
18] noted a higher rate of vitamin D deficiency in males with severe visceral obesity, while no correlation was noted in females. This sex disparity might be explained by hormonal change variations between sexes; males are likely to experience less pronounced hormonal change in old age than females.
The inverse relationship between vitamin D and VAT may be explained by several proposed mechanisms. One hypothesis is that obesity leads to decreased outdoor activity and sun exposure, resulting in lower vitamin D synthesis [
19]. However, experimental studies have shown that sun exposure alone cannot account for the difference in vitamin D concentrations between individuals with and without obesity [
19]. Another proposed mechanism is vitamin D sequestration in adipose tissue caused by its fat-soluble nature, potentially reducing its bioavailability in individuals with obesity [
20]. Additionally, vitamin D deficiency may increase lipogenesis by elevating parathyroid hormone secretion and increasing calcium influx into adipocytes [
21,
22].
However, some studies have reported conflicting results. Cisneiros et al. [
23] found that in low-risk pregnant women, maternal visceral fat was not associated with serum vitamin D levels. Conversely, Bazshahi et al. [
24] reported a positive relationship between serum vitamin D levels and body fat percentage. Differences in study populations, measurement techniques, or confounding factors may explain these discrepancies.
Moreover, our study found that BMI was independently associated with VAT mass. This finding is consistent with previous research suggesting that these anthropometric measures are reliable noninvasive indicators of visceral adiposity in adults [
25,
26,
27].
CONCLUSION
Serum vitamin D levels showed a weak negative association with VAT in older adults. BMI was identified as the most robust predictor of VAT in both sexes. These findings aid in clarifying the complex relationship between vitamin D status and body composition in aging populations.
However, owing to the cross-sectional nature of the study, the causality could not be determined. Therefore, future prospective studies need to outline the long-term effect of vitamin D on visceral adiposity. Additionally, while DXA was used to measure VAT in this study, more precise measures such as computed tomography scans can provide more accurate values for future studies.
NOTES
-
Conflict of Interest: The authors declare that they have no competing interests.
-
Author Contributions:
Conceptualization:Behnamzade M, Hosseini SR, Ghadimi R.
Data curation:Ghadimi R, Bijani A, Ashrafpour M.
Formal analysis:Bijani A, Hosseini SR.
Methodology:Hosseini SR, Ashrafpour M, Bijani A.
Writing - original draft:Behnamzade M, Adabi R.
Writing - review & editing:Behnamzade M, Hosseini SR, Adabi R.
ACKNOWLEDGEMENTS
The authors are thankful to the participants in the studies and also Deputy of Research and Technology of Babol University of Medical Science for the financial support.
REFERENCES
- 1. Jakovljevic M, Westerman R, Sharma T, Lamnisos D. Aging and global health. In: Haring R, Kickbusch I, Ganten D, Moeti M, editors. Handbook of global health. Cham: Springer Cham; 2021. p. 73-102.
- 2. World Health Organization. Ageing. Geneva: World Health Organization; 2020.
- 3. Gietel-Basten S, Marois G, Torabi F, Kabiri K. Reframing policy responses to population aging in Iran. Genus 2024;80:8.
- 4. Lim HJ, Xue H, Wang Y. Global trends in obesity. In: Meiselman HL, editor. Handbook of eating and drinking: interdisciplinary perspectives. Cham: Springer Cham, 2020. p. 1217-1235.
- 5. Poulos A. Obesity in the 21st Century. Berlin: Springer; 2023.
- 6. von Humboldt S. Obesity, perceived weight discrimination, and well-being. In: Gu D, Dupre ME, editors. Encyclopedia of gerontology and population aging. Cham: Springer Cham; 2022. p. 3579-3585.
- 7. Khan S, Chan YT, Revelo XS, Winer DA. The immune landscape of visceral adipose tissue during obesity and aging. Front Endocrinol (Lausanne) 2020;11:267.
- 8. Cesaro A, De Michele G, Fimiani F, Acerbo V, Scherillo G, et al. Visceral adipose tissue and residual cardiovascular risk: a pathological link and new therapeutic options. Front Cardiovasc Med 2023;10:1187735.
- 9. Bullón-Vela V, Abete I, Tur JA, Konieczna J, Romaguera D, et al. Relationship of visceral adipose tissue with surrogate insulin resistance and liver markers in individuals with metabolic syndrome chronic complications. Ther Adv Endocrinol Metab 2020;11:2042018820958298.
- 10. Song X, Qin S, Chen S, Zhang C, Lin L, et al. Bibliometric analysis of vitamin D and obesity research over the period 2000 to 2023. Front Pharmacol 2024;15:1445061.
- 11. Popa AD, Niță O, Caba L, Gherasim A, Graur M, et al. From the sun to the cell: examining obesity through the lens of vitamin D and inflammation. Metabolites 2023;14:4.
- 12. Park CY, Han SN. The role of vitamin D in adipose tissue biology: adipocyte differentiation, energy metabolism, and inflammation. J Lipid Atheroscler 2021;10:130-144.
- 13. Cominacini M, Fumaneri A, Ballerini L, Braggio M, Valenti MT, et al. Unraveling the connection: visceral adipose tissue and vitamin D levels in obesity. Nutrients 2023;15:4259.
- 14. Chattranukulchai Shantavasinkul P, Nimitphong H. Vitamin D and visceral obesity in humans: what should clinicians know? Nutrients 2022;14:3075.
- 15. Washburn RA, Smith KW, Jette AM, Janney CA. The Physical Activity Scale for the Elderly (PASE): development and evaluation. J Clin Epidemiol 1993;46:153-162.
- 16. Li YF, Zheng X, Gao WL, Tao F, Chen Y. Association between serum vitamin D levels and visceral adipose tissue among adolescents: a cross-sectional observational study in NHANES 2011–2015. BMC Pediatr 2022;22:634.
- 17. Ganji V, Shi Z, Alshami H, Ajina S, Albakri S, et al. Serum 25-hydroxyvitamin D concentrations are inversely associated with body adiposity measurements but the association with bone mass is non-linear in postmenopausal women. J Steroid Biochem Mol Biol 2021;212:105923.
- 18. Kim YA, Cho YJ. The association between visceral fat, subcutaneous fat and serum 25-hydroxyvitamin D3 levels. Obesity Medicine 2019;13:29-33.
- 19. Cheng S, Massaro JM, Fox CS, Larson MG, Keyes MJ, et al. Adiposity, cardiometabolic risk, and vitamin D status: the Framingham Heart Study. Diabetes 2010;59:242-248.
- 20. Wortsman J, Matsuoka LY, Chen TC, Lu Z, Holick MF. Decreased bioavailability of vitamin D in obesity. Am J Clin Nutr 2000;72:690-693.
- 21. Szymczak-Pajor I, Miazek K, Selmi A, Balcerczyk A, Śliwińska A. The action of vitamin D in adipose tissue: is there the link between vitamin D deficiency and adipose tissue-related metabolic disorders? Int J Mol Sci 2022;23:956.
- 22. McCarty MF, Thomas CA. PTH excess may promote weight gain by impeding catecholamine-induced lipolysis-implications for the impact of calcium, vitamin D, and alcohol on body weight. Med Hypotheses 2003;61:535-542.
- 23. Cisneiros R, Segatto J, Paixão E, Bacellar Í, Lima M, et al. Vitamin D deficiency and visceral adipose tissue in early pregnant women. BMC Pregnancy Childbirth 2021;21:476.
- 24. Bazshahi E, Pourreza S, Ghanbari M, Khademi Z, Amini MR, et al. Association of vitamin D status with visceral adiposity index and lipid accumulation product index among a group of Iranian people. Clin Nutr Res 2021;10:150-160.
- 25. Pasanta D, Htun KT, Pan J, Tungjai M, Kaewjaeng S, et al. Waist circumference and BMI are strongly correlated with MRI-derived fat compartments in young adults. Life (Basel) 2021;11:643.
- 26. Borruel S, Moltó JF, Alpañés M, Fernández-Durán E, Álvarez-Blasco F, et al. Surrogate markers of visceral adiposity in young adults: waist circumference and body mass index are more accurate than waist hip ratio, model of adipose distribution and visceral adiposity index. PLoS One 2014;9:e114112.
- 27. Sommer I, Teufer B, Szelag M, Nussbaumer-Streit B, Titscher V, et al. The performance of anthropometric tools to determine obesity: a systematic review and meta-analysis. Sci Rep 2020;10:12699.

 , Reza Adabi1

