ABSTRACT
This study aimed to examine the relationship between nutrition intake and estimated glomerular filtration rate (eGFR) indicating kidney function in Korean individuals without diabetes or cardiovascular disease. Study participants from the Korea National Health and Nutrition Examination Survey 2013–2014 (n = 4,378, 30–65 years) were classified by their eGFR levels (mL/min/1.732 m2): ≥ 120 (n = 299), 119–105 (n = 789), 104–90 (n = 1,578), 89–60 (n = 1,685), < 60 (n = 27). After adjusted for confounding factors (age, sex, cigarette smoking, alcohol drinking, total caloric intake [TCI], income status, education level, body mass index, and physical activity), blood pressure, low-density lipoprotein (LDL) cholesterol, aspartate aminotransferase, alanine aminotransferase, blood urea nitrogen, creatinine, fasting glucose, and glycated hemoglobin were higher, and high density lipoprotein cholesterol levels were lower in participants with lower eGFR levels than those with higher eGFR levels. n-3 fatty acid (FA) and n-6 FA (% of TCI/day) intake were also significantly higher in participants with higher eGFR levels than in those with lower eGFR levels. Based on the above results, participants were subdivided into 3 groups according to n-6 FA intake levels (Q1: ≥ 2.93%, n = 1,462; Q2: 2.92%–1.88%, n = 1,463; Q3: < 1.88%, n = 1,453). People consuming higher n-6 FAs, particularly the Q1 group showed higher eGFR levels and lower levels of LDL cholesterol and creatinine. In conclusion, higher intake of n-6 FAs within the range of dietary reference may be beneficial to maintain healthy kidney function.
-
Keywords: N-6 fatty acid; Estimated glomerular filtration rate; Kidney
INTRODUCTION
The number of patients with chronic kidney disease (CKD) in Korea has been increasing every year, and the number of dialysis patients has reached approximately 58,000 in 2015 [
1]. According to the report of Korean Society of Nephrology in 2015, the number of CKD patients receiving dialysis treatment has increased approximately 30 times over last 30 years. Furthermore, the number of kidney transplantations increased from 2.6 per 100,000 people in 2010 which was less than the average value of 3.4 among the member countries belonging to the Organization for Economic Co-operation and Development (OECD), to 3.3 in the following year which reached the OECD average [
2]. In 2015, the United States Renal Data System announced that the rate of increase in the number of CKD patients in Korea ranked 3rd, following the USA and Mexico. As the number of CKD patients thus increases, medical expenses also rise [
1]. In particular, as the stage of CKD progresses, active therapies such as dialysis and transplantation are given, and the medical expense increases exponentially as the disease reaches the last stage [
3]. In 2011, the estimated total socioeconomic cost for CKD in Korea was 5,021.9 billion won which is relatively higher than the cost for other major chronic diseases: 3,894.8 billion won for chronic hepatic diseases (including cancer) and 816.5 billion won for chronic obstructive pulmonary disease [
3].
Various factors such as lifestyle, diet, and environmental factors are responsible for increasing the number of CKD patients [
4,
5,
6,
7,
8,
9]. Using the data from the Korea National Health and Nutrition Examination Survey (KNHANES) 2007–2009, Lee and Chung [
4] reported that the risk of developing CKD was 2.06 times higher for cigarette smokers, 2.12 times for non-exercisers, 2.4 times for people with hypertension, and 2.32 times for people with anemia, compared with their counterparts. In addition, high protein intake and salty diet greatly increases the risk of kidney function [
7,
8,
9,
10,
11]. High protein intake increases the glomerular filtration rate that ultimately damages the kidney with an excessive strain on the organ [
11]. Also, the high salt intake raises blood pressure (BP) by increasing fluid retention, and augments sodium-related kidney damage that is independent of the fluid condition [
7,
8,
9]. Furthermore, the number of patients with hypertension has been increasing every year in Korea: particularly, in Busan, Ulsan, and Gyeongsangnam-do region, the number of hypertensive patients reached 870,000 in 2015, and the number of CKD patients has also tended to increase. Consequently, socioeconomic expenditures increase and affect the quality of life in CKD patients, which indicates the importance of establishing the effective strategies for both prevention and management of CKD [
3].
Therefore, this study aimed to examine the relationship between nutrition intake and estimated glomerular filtration rate (eGFR) indicating kidney function in Korean individuals, using the database from the KNHANES 2013–2014, to provide scientific evidence for the prevention and management of CKD.
MATERIALS AND METHODS
Study participants and data collection
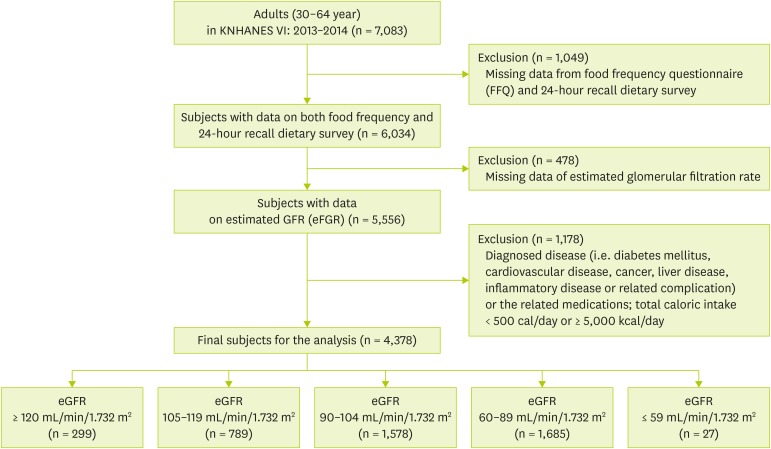
This study was based on data from the KNHANES 2013–2014. The KNHANES is a nationwide, cross sectional, multistage and stratified survey conducted by the Korea Centers for Disease Control and Prevention (KCDC). The survey has information such as health interview, anthropometric and biochemical measures, health examination and nutrition survey, etc. Among 7,083 individuals (30–64 years), we excluded participants who lacked data on nutrient intake information from the food frequency questionnaire (FFQ) survey and 24-hour recall dietary survey (n = 1,049), and on eGFR (n = 478), and were diagnosed for chronic disease such as diabetes mellitus, cardiovascular disease, cancer, liver disease, inflammatory disease, and related complication (n = 1,178). Also, participants who had total caloric intake (TCI) < 500 kcal/day or ≥ 5,000 kcal/day were excluded [
12]. Finally, 4,378 individuals were included in the final analysis (
Figure 1). The procedures for conducting the KNHANES were approved by the Institutional Review Board of the Korean Center for Disease Control and Prevention (2013-07CON-03-4C, 2013-12EXP-03-5C), and written informed consent was obtained from all survey participants.
Figure 1
Selection of study participants.
KNHANES, Korea National Health and Nutrition Examination Survey; eGFR, estimated glomerular filtration rate; FFQ, food frequency questionnaire.
In addition, metabolic syndrome was defined as presence of the following 5 criteria based on the modification of the guidelines from National Cholesterol Education Program-Adult Treatment Panel (NCEP-ATP) III, American Diabetic Association and the Korean Society of Study for Obesity [
13]: 1) waist ≥ 90 cm in male and ≥ 85 cm in female, 2) systolic BP ≥ 135 mmHg or diastolic BP ≥ 85 mmHg, 3) triglyceride (TG) ≥ 150 mg/dL, 4) high-density lipoprotein (HDL) cholesterol ≤ 40 mg/dL in male and ≤ 50 mg/dL in female, and 5) fasting glucose ≥ 100 mg/dL. Obesity was defined as body mass index (BMI) ≥ 25 kg/m
2 according to the Korean Society of Study for Obesity [
14]. The health interview included the following variables: age, sex, income status, education status, smoking habit, and alcohol consumption. Education status was categorized into 2 groups: less than high school education, and greater than or equals to high school education. Income status was categorized into 4 groups: lowest, lower middle, upper middle, and highest. Trained medical staff investigated anthropometric and biochemical parameters. Height and weight were measured light clothing without shoes. BMI was calculated as the ratio of weight/height
2 (kg/m
2). Systolic BP and diastolic BP were measured with mercury sphygmomanometer (Baumanometer, Baum, Copiague, NY USA). Waist circumference was measured using measuring tape middle point of last rip below and the upper of iliac crest.
After an overnight fasting for at least 8 hours, blood sample were obtained in the morning. The blood urea nitrogen (BUN), creatinine, fasting glucose, total cholesterol, HDL cholesterol, TG, low-density lipoprotein (LDL) cholesterol, aspartate aminotransferase (AST), and alanine aminotransferase (ALT) were measured using a Hitachi Automatic Analyzer 7600-210 (Hitachi, Tokyo, Japan). Hemoglobin A1c was measured using a Tosoh G8 (Tosoh, Tokyo, Japan).
eGFR
Kidney function of the study participants were classified by their eGFR level (mL/min/1.732 m
2), according to the Kidney Disease Outcomes Quality Initiative guideline [
5]: ≥ 120 (n = 299), 119–105 (n = 789), 104–90 (n = 1,578), 89–60 (n = 1,685), ≤ 59 (n = 27) (
Figure 1). The eGFR was calculated using the equation from the Modification of Diet in Renal Disease study:
Nutritionists visited each participant's household and interviewed individual for conducting 24-hour recall dietary survey and FFQ survey. FFQ consisted of 112 items, the 9 levels of frequency (3 times/day, 2 times/day, 1 time/day, 5–6 times/week, 2–4 times/week, 1 time/week, 2–3 times/month, 1 time/month, nearly not to eat), and 3–4 categories of food intake duration (the number of day, week, and month). FFQ reflected food intake patterns during the recent 1 year, and included 2 basics questions (change of eating habits for a year and number of meals for a day). In 24-hour recall survey, participants recorded their diet of a day before the investigation. The survey questions included meal information, names of dishes, and the amount of each food intake. They also included additional information such as eating of cooked foods, and manufacturing company, etc. Nutrient intake information included TCI (kcal/day), carbohydrate, protein, fat, saturated fatty acid (SFA), mono unsaturated fatty acid (MUFA), poly unsaturated fatty acid (PUFA), n-3 fatty acid (FA), n-6 FA, and dietary fiber.
Statistical analysis
All analysis was performed using SPSS statistical software (SPSS version 23.0; IBM Corp., Chicago, IL, USA). Data are presented as the mean ± standard error. The χ2 test was used to investigate the following variables: sex, smoking, alcohol drinking, income status, education status, metabolic syndrome, dyslipidemia, obesity, hypertension, etc. Differences among the subgroups were tested by analysis of variance followed by Bonferroni method and general linear model methods for the adjustment (i.e., age, sex, cigarette smoking, alcohol drinking, TCI, income status, education level, BMI, and physical activity, etc.). We used Pearson's and partial correlation to examine if eGFR levels are related to anthropometric parameters, biochemical measures, and nutrient intake. The p value < 0.05 was considered statistically significant.
RESULTS
General characteristics of study population
Table 1 shows general characteristics of study population according to eGFR levels. As the eGFR levels decreased, people were older, and higher proportions of female, metabolic syndrome, and obesity were observed. Education level and income status were also different among the groups.
Table 1General characteristics of study population according to eGFR levels
Table 1
|
Characteristics |
eGFR, mL/min/1.732 m2
|
p |
|
≥ 120 (n = 299) |
119–105 (n = 789) |
104–90 (n = 1,578) |
89–60 (n = 1,685) |
≤ 59 (n = 27) |
|
eGFR, mL/min/1.732 m2
|
130.40 ± 0.63 |
111.30 ± 0.15 |
96.90 ± 0.11 |
80.60 ± 0.16 |
52.50 ± 1.62 |
< 0.001 |
|
Age, yr |
41.50 ± 0.56 |
43.40 ± 0.34 |
45.20 ± 0.23 |
48.70 ± 0.23 |
54.70 ± 1.54 |
< 0.001 |
|
Male |
63 (21.1) |
225 (28.5) |
592 (37.5) |
809 (48.0) |
14 (51.9) |
< 0.001 |
|
Metabolic syndrome |
33 (11.0) |
126 (16.0) |
226 (14.3) |
293 (17.4) |
7 (25.9) |
0.011 |
|
Obesity |
85 (28.4) |
277 (35.1) |
558 (35.4) |
735 (43.6) |
16 (59.3) |
< 0.001 |
|
Current smoker |
46 (16.2) |
145 (19.4) |
311 (20.9) |
350 (22.1) |
4 (16.0) |
0.165 |
|
Current drinker |
154 (54.2) |
427 (57.1) |
857 (57.5) |
896 (56.5) |
12 (48.0) |
0.747 |
|
Education |
|
|
|
|
|
0.567 |
|
≥ High school |
233 (77.9) |
596 (75.5) |
1,203 (76.2) |
1,226 (72.8) |
18 (66.7) |
|
Income status |
|
|
|
|
|
0.013 |
|
Lowest |
23 (7.7) |
79 (9.7) |
114 (7.2) |
144 (8.6) |
2 (8.2) |
|
Lower middle |
82 (27.5) |
210 (26.8) |
356 (22.6) |
409 (24.4) |
10 (37.0) |
|
Upper middle |
111 (37.2) |
263 (33.5) |
540 (34.3) |
526 (31.4) |
7 (25.9) |
|
Highest |
82 (27.5) |
236 (30.1) |
564 (35.8) |
598 (35.7) |
8 (29.6) |
Anthropometric and biochemical parameters and nutrient intakes of study population according to eGFR levels
Table 2 presents anthropometric and biochemical parameters of study participants according to eGFR levels. People with lower eGFR levels than those with higher eGFR levels, showed higher levels of BPs, LDL cholesterol, fasting glucose, glycated hemoglobin, AST, ALT, BUN, and serum creatinine before and after the adjustments for age, sex, cigarette smoking, alcohol drinking, TCI, income status, education level, BMI, and physical activity. Regarding the nutrient intakes, percentage of TCI derived from n-3 FAs and n-6 FAs were significantly lower in lower eGFR groups (eGFR: 60–89 and eGFR: ≤ 59) compared with those in higher eGFR groups (eGFR: ≥ 90) after adjusted for confounding factors (
Table 3).
Table 2Anthropometric and biochemical parameters of study population according to eGFR levels
Table 2
|
Characteristics |
eGFR, mL/min/1.732 m2
|
p0
|
p1
|
p2
|
|
≥ 120 (n = 299) |
119–105 (n = 789) |
104–90 (n = 1,578) |
89–60 (n = 1,685) |
≤ 59 (n = 27) |
|
eGFR, mL/min/1.732 m2
|
130.40 ± 0.63 |
111.30 ± 0.15 |
96.90 ± 0.11 |
80.60 ± 0.16 |
52.50 ± 1.62 |
< 0.001 |
< 0.001 |
< 0.001 |
|
BMI, kg/m2
|
23.10 ± 0.20 |
23.60 ± 0.12 |
23.60 ± 0.08 |
24.20 ± 0.08 |
24.90 ± 0.68 |
< 0.001 |
- |
- |
|
SBP, mmHg |
112.10 ± 0.89 |
113.20 ± 0.54 |
114.10 ± 0.38 |
116.50 ± 0.37 |
129.90 ± 4.46 |
< 0.001 |
0.003 |
0.002 |
|
DBP, mmHg |
73.30 ± 0.63 |
74.70 ± 0.36 |
75.60 ± 0.25 |
77.50 ± 0.25 |
83.50 ± 3.06 |
< 0.001 |
0.028 |
0.045 |
|
TGs*, mg/dL |
142.60 ± 9.69 |
134.20 ± 4.13 |
133.20 ± 2.72 |
140.70 ± 2.43 |
145.10 ± 14.5 |
< 0.001 |
0.217 |
0.371 |
|
LDL cholesterol*, mg/dL |
103.30 ± 1.75 |
108.50 ± 1.03 |
113.00 ± 0.75 |
116.70 ± 0.75 |
114.50 ± 8.79 |
< 0.001 |
< 0.001 |
< 0.001 |
|
Total cholesterol, mg/dL |
185.00 ± 2.05 |
188.00 ± 1.24 |
192.10 ± 0.84 |
196.20 ± 0.83 |
196.40 ± 9.93 |
< 0.001 |
0.078 |
0.116 |
|
HDL cholesterol, mg/dL |
56.30 ± 0.77 |
54.00 ± 0.44 |
53.50 ± 0.30 |
52.10 ± 0.30 |
53.00 ± 3.40 |
< 0.001 |
0.382 |
0.233 |
|
AST, U/L |
21.00 ± 0.71 |
20.60 ± 0.35 |
21.10 ± 0.23 |
22.00 ± 0.24 |
33.80 ± 11.4 |
< 0.001 |
< 0.001 |
< 0.001 |
|
ALT, U/L |
19.70 ± 0.78 |
20.50 ± 0.58 |
21.30 ± 0.46 |
22.00 ± 0.42 |
31.90 ± 9.55 |
0.003 |
0.012 |
0.023 |
|
BUN, mg/dL |
12.10 ± 0.21 |
12.70 ± 0.12 |
13.50 ± 0.09 |
14.80 ± 0.09 |
20.70 ± 1.58 |
< 0.001 |
< 0.001 |
< 0.001 |
|
Creatinine, mg/dL |
0.59 ± 0.00 |
0.68 ± 0.00 |
0.78 ± 0.00 |
0.93 ± 0.00 |
1.35 ± 0.06 |
< 0.001 |
< 0.001 |
< 0.001 |
|
Fasting glucose*, mg/dL |
97.40 ± 1.41 |
95.90 ± 0.56 |
96.30 ± 0.38 |
97.70 ± 0.41 |
99.50 ± 3.15 |
0.007 |
0.013 |
0.017 |
|
HbA1c, % |
5.68 ± 0.05 |
5.63 ± 0.02 |
5.67 ± 0.01 |
5.74 ± 0.01 |
5.96 ± 0.11 |
< 0.001 |
0.026 |
0.034 |
Table 3Nutrient intakes of study population according to eGFR levels
Table 3
|
Characteristics |
eGFR, mL/min/1.732 m2
|
p0
|
p1
|
p2
|
|
≥ 120 (n = 299) |
119–105 (n = 789) |
104–90 (n = 1,578) |
89–60 (n = 1,685) |
≤ 59 (n = 27) |
|
TCI, kcal/day |
2,012.5 ± 48.1 |
2,010.8 ± 28.3 |
2,075.9 ± 20.3 |
2,108.0 ± 19.9 |
1,817.3 ± 121.8 |
0.016 |
- |
- |
|
Carbohydrate (% of TCI) |
63.00 ± 0.66 |
63.30 ± 0.40 |
63.30 ± 0.29 |
64.30 ± 0.27 |
69.50 ± 2.46 |
0.004 |
0.068 |
0.639 |
|
Protein (% of TCI) |
14.70 ± 0.27 |
14.40 ± 0.14 |
14.50 ± 0.11 |
14.20 ± 0.10 |
13.30 ± 0.72 |
0.072 |
0.294 |
0.225 |
|
Fat (% of TCI) |
19.90 ± 0.50 |
20.00 ± 0.31 |
19.80 ± 0.23 |
19.10 ± 0.21 |
15.40 ± 1.90 |
0.005 |
0.350 |
0.379 |
|
SFA (% of TCI) |
5.81 ± 0.19 |
6.00 ± 0.12 |
5.82 ± 0.08 |
5.54 ± 0.07 |
4.27 ± 0.54 |
0.001 |
0.222 |
0.221 |
|
MUFA (% of TCI) |
6.38 ± 0.19 |
6.54 ± 0.13 |
6.43 ± 0.09 |
6.10 ± 0.08 |
4.86 ± 0.73 |
0.004 |
0.459 |
0.520 |
|
PUFA (% of TCI) |
5.23 ± 0.16 |
5.07 ± 0.10 |
5.02 ± 0.07 |
5.05 ± 0.07 |
4.45 ± 0.62 |
0.620 |
0.463 |
0.594 |
|
n-3 FA (% of TCI) |
0.85 ± 0.05 |
0.80 ± 0.03 |
0.74 ± 0.02 |
0.61 ± 0.01 |
0.69 ± 0.05 |
< 0.001 |
< 0.001 |
< 0.001 |
|
n-6 FA (% of TCI) |
4.79 ± 0.25 |
4.46 ± 0.16 |
3.89 ± 0.10 |
2.15 ± 0.02 |
2.44 ± 0.19 |
< 0.001 |
< 0.001 |
< 0.001 |
Relationship of eGFR levels with anthropometric, biochemical parameters and nutrient intakes
Table 4 shows the relationship of eGFR levels with anthropometric and biochemical parameters, and nutrient intakes. After adjusted for age, sex, cigarette smoking, alcohol drinking, TCI, income status, education level, BMI, and physical activity, eGFR levels were significantly correlated with DBP (r = −0.043, p = 0.006), BUN (r = −0.204, p < 0.001), creatinine (r = −0.972, p < 0.001), total cholesterol (r = −0.045, p = 0.005), and LDL cholesterol (r = −0.071, p < 0.001) in whole study population. Among the nutrient intakes, n-3 FAs (r = 0.082, p < 0.001), and n-6 FAs (r = 0.176, p < 0.001) were positively correlated with eGFR levels before and after the adjustment (
Table 4). Particularly, correlation co-efficient values for n-6 FAs were bigger than those for TCI or n-3 FAs.
Table 4Partial correlation: relationship of anthropometric and biochemical parameters and nutrient intakes with eGFR levels
Table 4
|
Characteristics |
Total population (n = 4,378) |
|
r1
|
p1
|
r2
|
p2
|
r3
|
p3
|
|
BMI, kg/m2
|
−0.040 |
0.012 |
- |
- |
- |
- |
|
SBP, mmHg |
0.001 |
0.932 |
0.012 |
0.453 |
0.008 |
0.607 |
|
DBP, mmHg |
−0.048 |
0.002 |
−0.040 |
0.012 |
−0.043 |
0.006 |
|
BUN, mg/dL |
−0.194 |
< 0.001 |
−0.193 |
< 0.001 |
−0.204 |
< 0.001 |
|
Creatinine, mg/dL |
−0.987 |
< 0.001 |
−0.987 |
< 0.001 |
−0.972 |
< 0.001 |
|
Fasting glucose*, mg/dL |
0.020 |
0.201 |
0.030 |
0.057 |
0.031 |
0.052 |
|
HbA1c, % |
−0.002 |
0.908 |
0.006 |
0.718 |
0.008 |
0.593 |
|
Total cholesterol, mg/dL |
−0.052 |
0.001 |
−0.046 |
0.004 |
−0.045 |
0.005 |
|
HDL cholesterol, mg/dL |
0.032 |
0.043 |
0.023 |
0.149 |
0.019 |
0.237 |
|
TGs*, mg/dL |
0.006 |
0.690 |
0.020 |
0.212 |
0.020 |
0.204 |
|
LDL cholesterol*, mg/dL |
−0.078 |
< 0.001 |
−0.074 |
< 0.001 |
−0.071 |
< 0.001 |
|
AST, U/L |
−0.006 |
0.703 |
−0.002 |
0.924 |
−0.002 |
0.913 |
|
ALT, U/L |
−0.006 |
0.682 |
0.003 |
0.834 |
0.003 |
0.840 |
|
Total energy and nutrient intake |
|
|
|
|
|
|
|
TCI, kcal/day |
0.042 |
0.007 |
- |
- |
- |
- |
|
Carbohydrate (% of TCI) |
0.001 |
0.948 |
< 0.001 |
0.975 |
−0.006 |
0.689 |
|
Protein (% of TCI) |
0.030 |
0.060 |
0.031 |
0.052 |
0.028 |
0.081 |
|
Fat (% of TCI) |
−0.017 |
0.287 |
−0.017 |
0.292 |
−0.021 |
0.193 |
|
SFA (% of TCI) |
−0.013 |
0.428 |
−0.013 |
0.413 |
−0.012 |
0.454 |
|
MUFA (% of TCI) |
−0.014 |
0.375 |
−0.014 |
0.384 |
−0.016 |
0.321 |
|
PUFA (% of TCI) |
−0.014 |
0.369 |
−0.014 |
0.380 |
−0.014 |
0.375 |
|
n-3 FA (% of TCI) |
0.081 |
< 0.001 |
0.082 |
< 0.001 |
0.082 |
< 0.001 |
|
n-6 FA (% of TCI) |
0.176 |
< 0.001 |
0.176 |
< 0.001 |
0.176 |
< 0.001 |
|
n-6/n-3 (% of TCI) |
0.157 |
< 0.001 |
0.156 |
< 0.001 |
0.155 |
< 0.001 |
General characteristics, anthropometric, and biochemical parameters according to n-6 FA intake levels
Based on the above results for relationship between eGFR levels and n-6 FA intake, participants were subdivided into 3 groups according to n-6 FA intake levels (% of TCI): Q1 (≥ 2.93%); Q2 (2.92%–1.88%), and Q3 (< 1.88%) groups. The proportions of metabolic syndrome and obesity were significantly lower in the Q1 group (13.5% and 32.6%, respectively) than those in the other groups (Q2: 16.7% and 40.9%; Q3: 16.8% and 41.1%, respectively) (p = 0.02, p < 0.001, respectively). People consuming higher n-6 FAs, particularly those in the Q1 group showed higher eGFR levels and lower levels of LDL cholesterol and serum creatinine after the adjustment (
Table 5).
Table 5Anthropometric and biochemical parameters of study population according to n-6 FA intake levels
Table 5
|
Characteristics |
n-6 FA intake rate (%) |
p1
|
p2
|
p3
|
|
Q1 (≥ 2.93%) (n = 1,462) |
Q2 (2.92%–1.88%) (n = 1,463) |
Q3 (< 1.88%) (n = 1,453) |
|
BMI, kg/m2
|
23.40 ± 0.09 |
24.00 ± 0.08 |
24.10 ± 0.08 |
< 0.001 |
- |
- |
|
SBP, mmHg |
112.30 ± 0.39 |
116.30 ± 0.42 |
116.10 ± 0.39 |
< 0.001 |
0.086 |
0.095 |
|
DBP, mmHg |
74.50 ± 0.27 |
76.40 ± 0.27 |
77.20 ± 0.27 |
< 0.001 |
0.817 |
0.846 |
|
TGs*, mg/dL |
126.80 ± 2.99 |
137.10 ± 2.68 |
147.10 ± 3.05 |
< 0.001 |
0.663 |
0.762 |
|
LDL cholesterol*, mg/dL |
108.60 ± 0.79 |
115.00 ± 0.79 |
115.20 ± 0.80 |
< 0.001 |
< 0.001 |
< 0.001 |
|
Total cholesterol, mg/dL |
187.80 ± 0.92 |
194.70 ± 0.88 |
194.90 ± 0.89 |
< 0.001 |
0.100 |
0.090 |
|
HDL cholesterol, mg/dL |
55.0 ± 0.34 |
53.10 ± 0.32 |
51.60 ± 0.31 |
< 0.001 |
0.270 |
0.263 |
|
AST, U/L |
20.40 ± 0.32 |
21.80 ± 0.28 |
22.20 ± 0.24 |
< 0.001 |
0.232 |
0.255 |
|
ALT, U/L |
19.90 ± 0.46 |
21.30 ± 0.46 |
22.90 ± 0.46 |
< 0.001 |
0.916 |
0.935 |
|
eGFR, mL/min/1.732 m2
|
101.50 ± 0.42 |
92.50 ± 0.41 |
91.80 ± 0.40 |
< 0.001 |
< 0.001 |
< 0.001 |
|
BUN, mg/dL |
12.90 ± 0.10 |
14.10 ± 0.10 |
14.40 ± 0.10 |
< 0.001 |
0.116 |
0.108 |
|
Creatinine, mg/dL |
0.75 ± 0.00 |
0.81 ± 0.00 |
0.87 ± 0.00 |
< 0.001 |
< 0.001 |
< 0.001 |
|
Fasting glucose*, mg/dL |
94.70 ± 0.39 |
97.70 ± 0.42 |
98.20 ± 0.49 |
< 0.001 |
0.532 |
0.512 |
|
HbA1c, % |
5.59 ± 0.01 |
5.74 ± 0.01 |
5.74 ± 0.02 |
< 0.001 |
0.323 |
0.354 |
DISCUSSION
In this study, eGFR levels indicating kidney function were significantly correlated with adiposity, BPs, lipid profiles, liver and kidney function parameters even in healthy people who do not have any complication or chronic disease related to kidney function. Furthermore, TCI, and proportions of TCI derived from n-3 FAs, and particularly n-6 FAs among the nutrient intakes were positively related to eGFR levels. This is the first report of showing the association between n-6 FA intake and eGFR levels in Asians.
CKD is known to cause many complications such as diabetic nephropathy, cardiovascular risk, heart failure, etc. [
15]. Also, kidney function is closely associated with health-related behaviors, especially eating habits and nutrient intake [
16,
17,
18]. Many previous studies have focused on n-3 FAs in reporting the relationship between nutrients and kidney function/disease. A 4-year diabetic cohort (n = 676) study performed in Taiwan reported that high concentrations of n-3 FA or n-3/n-6 PUFAs might prevent weakening of kidney function [
19]. In a cohort study for kidney transplant receivers performed in Norway, higher intake of marine n-3 PUFA levels have been related with lower hazard ratios for death from cardiovascular disease and infectious disease [
20]. On the contrary, Malhotra et al. [
21] showed in their southern community cohort study, that the odds ratios (ORs) for the incidence of the end stage of renal disease (ESRD) in subjects consuming higher n-6 FAs were significantly lower than those consuming lower n-6 FA intake (ORs, 0.81; 95% CIs, 0.61–1.06; p = 0.04), but n-3 FA intake level was not associated with the incidence of ESRD. It is partly in accordance with our results that participants who consumed higher proportion of calorie intake derived from n-6 FA had higher eGFR levels which may indicate a lower risk for the decreased kidney function compared with those who consumed lower n-6 FA intake.
Major sources of dietary n-6 FAs are plant oils, seeds, and nuts [
22]. Linoleic acid (LA, C18:2n-6), γ-linolenic acid (GLA, C18:3n-6), and arachidonic acid (AA, C20:4n-6) occupy 98% of n-6 FAs that people consume. LA and α-linoleic acid (ALA, C18:3n3) are important essential FAs and precursor of eicosanoids [
23]. Several studies have reported the positive effect of n-6 FAs on endocrine metabolisms [
21,
24]. Bjermo et al. [
22] in their randomized controlled trial, showed that a diet high in n-6 PUFAs reduced liver fat accumulation, and modestly improved metabolic status such as blood lipids and fasting insulin without weight loss, compared with a diet rich in SFA. Also, n-6 PUFA lowered the level of plasma LDL cholesterol but decreased the concentrations of tumor necrosis factor (TNF)-receptor 2 and interleukin (IL)-1 receptor antagonist. In fact, most of previous study have reported the beneficial effect of n-3 FAs and the adverse effect of n-6 FAs on inflammatory responses [
23,
25,
26,
27]. For example, Liu et al. [
25] shows that high n-3/n-6 PUFA intake group had reduced pro-inflammatory cytokine levels including TNF-α, IL-6, and C-reactive protein compared with the high SFA intake group, whereas excessive n-6 FA intakes were reported to cause platelet aggregation in those who took anticoagulant agent, to trigger inflammatory process and to increase vasoconstriction in all tissues including gastrointestinal tract [
23]. However, others reported that adequate intake of n-6 FAs may reduce platelet aggregation, and increase vasodilation in the kidney, central nerve system and endothelium [
21,
22,
24]. In Korea, the 2015 Korean Dietary Reference Intakes (KDRIs) recommends daily allowances of n-3 FAs and n-6 FAs from TCI to be within 1% and 4%–10% of TCI, respectively [
23]. In this study, the ratio of n-6/n-3 FA intake from TCI according to the tertile n-6 FA groups were as follows: 6.36%:1.11% (5.72:1) in the Q1 group, 2.32%:0.62% (3.76:1) in the Q2 group, and 1.43%:0.34% (3.66:1) in the Q3 group, which means that the ratios in all 3 groups were close to the ranges recommended by the KDRIs. Particularly, the Q1 group who consumed higher proportion of n-6 FAs showed a relatively optimal ratio of n-6/n-3 FA intake than the other tertile groups. As mentioned above, participants in this study were not diagnosed for any of chronic disease, nor took medications. Based on the above results and subject characteristics, we assume that higher intake of n-6 FAs within the dietary allowance range in healthy people may be beneficial to maintain healthy kidney function.
In fact, our study has limitations. First, it is a cross-sectional study performed in healthy Koreans, which does not identify the causal effect of n-6 FA intake on eGFR level. Second, study participants were healthy Koreans without diagnosed for any of chronic disease. Therefore, it cannot be applied to all population. Additionally, the proportions of gender were significantly different among the eGFR quintile groups although further analyses were done with adjustment for sex and other confounding factors in this study. Therefore, further investigations are needed to examine if eGFR levels are related with gender and to identify the precise mechanisms for the role of n-6 FAs in kidney function.
National Research Foundation of Koreahttp://dx.doi.org/10.13039/5011000037252016R1A2B4013627
NOTES
-
Funding: This study was supported by the National Research Foundation of Korea grant funded by the Korean Government (2016R1A2B4013627).
-
Conflict of Interest: The authors declare that they have no competing interests.
ACKNOWLEDGEMENTS
We thank the research volunteers who participated in the study described in this manuscript.
REFERENCES
- 1. Health Insurance Review & Assessment Service (KR). Healthcare Bigdata Hub. Medical information statistics [Internet]. 2016. cited 2016 May 25. Available from http://opendata.hira.or.kr/op/opc/olapMfrnIntrsIlnsInfo.do
- 2. Organisation for Economic Cooperation and Development. OECD health statistics [Internet]. 2010. cited 2018 April 16. Available from https://doi.org/10.1787/data-00542-en
- 3. Kim TH. Study on the socioeconomic burden of chronic kidney disease. Cheongwon: Korea Centers for Disease Control and Prevention; 2012.
- 4. Lee SJ, Chung CW. Health behaviors and risk factors associated with chronic kidney disease in Korean patients with diabetes: the Fourth Korean National Health and Nutritional Examination Survey. Asian Nurs Res 2014;8:8-14.
- 5. Lee SW, Kim YC, Oh SW, Koo HS, Na KY, Chae DW, Kim S, Chin HJ. Trends in the prevalence of chronic kidney disease, other chronic diseases and health-related behaviors in an adult Korean population: data from the Korean National Health and Nutrition Examination Survey (KNHANES). Nephrol Dial Transplant 2011;26:3975-3980.
- 6. Park JI, Baek H, Jung HH. CKD and health-related quality of life: the Korea National Health and Nutrition Examination Survey. Am J Kidney Dis 2016;67:851-860.
- 7. Thijssen S, Kitzler TM, Levin LW. Salt: its role in chronic kidney disease. J Ren Nutr 2008;18:18-26.
- 8. McMahon EJ, Campbell KL, Bauer JD. Taste perception in kidney disease and relationship to dietary sodium intake. Appetite 2014;83:236-241.
- 9. Sanders PW. Effect of salt intake on progression of chronic kidney disease. Curr Opin Nephrol Hypertens 2006;15:54-60.
- 10. Higashiyama A, Watanabe M, Kokubo Y, Ono Y, Okayama A, Okamura T. NIPPON DATA80/90 Research Group. Relationships between protein intake and renal function in a Japanese general population: NIPPON DATA90. J Epidemiol 2010;20:S537-S543.
- 11. Shah BV. The changing role of dietary protein restriction in management of Chronic Kidney Disease (CKD). J Assoc Physicians India 2015;63:34-40.
- 12. Kim OY, Kwak SY, Kim B, Kim YS, Kim HY, Shin MJ. Selected food consumption mediates the association between education level and metabolic syndrome in Korean adults. Ann Nutr Metab 2017;70:122-131.
- 13. Park HS, Park CY, Oh SW, Yoo HJ. Prevalence of obesity and metabolic syndrome in Korean adults. Obes Rev 2008;9:104-107.
- 14. Kim MK, Lee WY, Kang JH, Kang JH, Kim BT, Kim SM, Kim EM, Suh SH, Shin HJ, Lee KR, Lee KY, Lee SY, Lee SY, Lee SK, Lee CB, Chung S, Jeong IK, Hur KY, Kim SS, Woo JT. Committee of Clinical Practice Guidelines; Korean Society for the Study of Obesity. 2014 clinical practice guidelines for overweight and obesity in Korea. Endocrinol Metab 2014;29:405-409.
- 15. Wiebe N, Klarenbach SW, Allan GM, Manns BJ, Pelletier R, James MT, Bello A, Hemmelgarn BR, Tonelli M. Alberta Kidney Disease Network. Potentially preventable hospitalization as a complication of CKD: a cohort study. Am J Kidney Dis 2014;64:230-238.
- 16. Smyth A, Griffin M, Yusuf S, Mann JF, Reddan D, Canavan M, Newell J, O'Donnell M. Diet and major renal outcomes: a prospective cohort study. The NIH-AARP Diet and Health Study. J Ren Nutr 2016;26:288-298.
- 17. Mekki K, Remaoun M, Belleville J, Bouchenak M. Hemodialysis duration impairs food intake and nutritional parameters in chronic kidney disease patients. Int Urol Nephrol 2012;44:237-244.
- 18. Khatri M, Moon YP, Scarmeas N, Cu Y, Gardener H, Cheung K, Wright CB, Sacco RL, Nickolas TL, Elkind MS. The association between a mediterranean-style diet and kidney function in the Northern Manhattan Study Cohort. Clin J Am Soc Nephrol 2014;9:1868-1875.
- 19. Chung HF, Lomg KZ, Hsu CC, Al Mamun A, Jhang HR, Shin SJ, Hwang SJ, Huang MC. Association of n-3 polyunsaturated fatty acids and inflammatory indicators with renal function decline in type 2 diabetes. Clin Nutr 2015;34:229-234.
- 20. Eide IA, Jenssen T, Hartmann A, Diep LM, Dahle DO, Reisaeter AV, Bjerve KS, Christensen JH, Schmidt EB, Svensson M. The association between marine n-3 polyunsaturated fatty acid levels and survival after renal transplantation. Clin J Am Soc Nephrol 2015;10:1246-1256.
- 21. Malhotra R, Cavanaugh KL, Blot WJ, Lkizler TA, Lipworth L, Kabagambe EK. Dietary polyunsaturated fatty acids and incidence of end-stage renal disease in the Southern Community Cohort Study. BMC Nephrol 2016;17:152.
- 22. Bjermo H, Iggman D, Kullberg J, Dahlman I, Johansson L, Persson L, Berglund J, Pulkki K, Basu S, Uusitupa M, Rudling M, Arner P, Cederholm T, Ahlström H, Risérus U. Effects of n-6 PUFAs compared with SFAs on liver fat, lipoproteins, and inflammation in abdominal obesity: a randomized controlled trial. Am J Clin Nutr 2012;95:1003-1012.
- 23. Ministry of Health and Welfare (KR). The Korean Nutrition Society. Dietary reference intakes for Koreans 2015. Sejong: Ministry of Health and Welfare; 2016.
- 24. Yuzbashian E, Asghari G, Mirmiran P, Hosseini FS, Azizi F. Associations of dietary macronutrients with glomerular filtration rate and kidney dysfunction: Tehran lipid and glucose study. J Nephrol 2015;28:173-180.
- 25. Liu HQ, Qiu Y, Mu Y, Zhang XJ, Liu L, Hou XH, Zhang L, Xu XN, Ji AL, Cao R, Yang RH, Wang F. A high ratio of dietary n-3/n-6 polyunsaturated fatty acids improves obesity-linked inflammation and insulin resistance through suppressing activation of TLR4 in SD rats. Nutr Res 2013;33:849-858.
- 26. Chung HF, Long KZ, Hsu CC, AlMamun A, Jhang HR, Shin SJ, Hwang SJ, Huang MC. Association of n-3 polyunsaturated fatty acids and inflammatory indicators with renal function decline in type 2 diabetes. Clin Nutr 2015;34:229-234.
- 27. Yang LG, Song ZX, Yin H, Wang YY, Shu GF, Lu HX, Wang SK, Sun GJ. Low n-6/n-3 PUFA ratio improves lipid metabolism, inflammation, oxidative stress and endothelial function in rats using plant oils as n-3 fatty acid source. Lipids 2016;51:49-59.