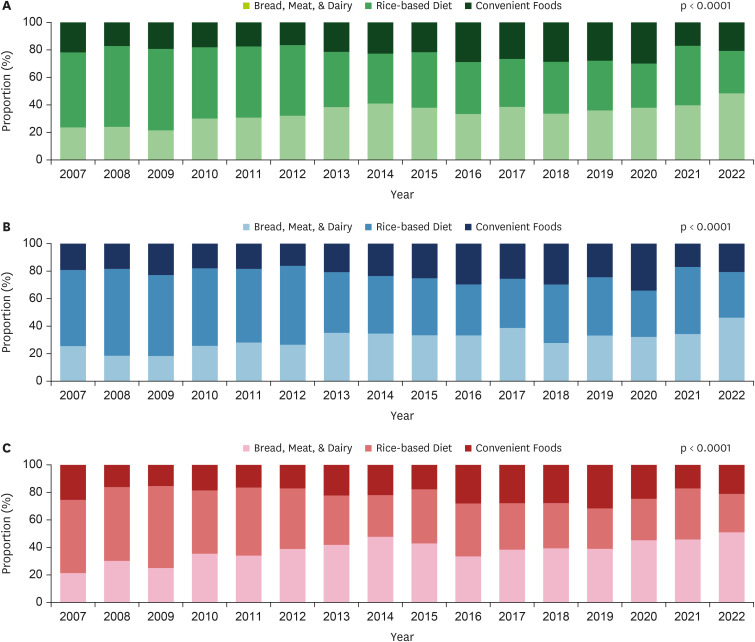
ABSTRACT
This study aimed to identify major dietary patterns among Korean adolescents, examine their changes over the past 16 years, and evaluate differences by sex. Data were analyzed from 7,679 adolescents aged 12–18 years who participated in the 2007–2022 Korea National Health and Nutrition Examination Survey and completed health, examination, and nutrition surveys. Dietary intake was assessed using a 24-hour recall, and cluster analysis was performed based on the energy contribution of 26 food groups. Associations between dietary patterns and nutrient intake were examined using survey-weighted linear regression. Three dietary patterns were identified: Bread, Meat, & Dairy (33.1%); Rice-based Diet (45.5%); and Convenient Foods (21.3%). Among boys, the Rice-based Diet group showed the highest prevalence of obesity and the largest proportion of low-income households, whereas the Bread, Meat, & Dairy group exhibited higher rates of supplement use and high-income status (all p < 0.05). Among girls, the Convenient Foods group tended to be older and was more likely to skip breakfast, consume alcohol, eat out daily, and perceive themselves as overweight (all p < 0.05). Over the 16-year period, adherence to the Bread, Meat, & Dairy pattern increased, whereas adherence to the Rice-based Diet pattern declined in both sexes (p < 0.01). These findings highlight a shift toward Westernized dietary patterns among Korean adolescents. Accordingly, nutrition policies and interventions should adopt tailored strategies that account for both sex and socioeconomic differences to promote healthier eating habits and support long-term adolescent health.
-
Keywords: Adolescents; Dietary patterns; Cluster analysis; KNHANES
INTRODUCTION
Adolescence is the second major growth period in life, characterized by accelerated growth and development, increased physical activity, and higher nutritional demands [
1]. From a public health perspective, this stage is critical because dietary habits formed during adolescence often persist into adulthood, shaping lifelong health outcomes [
2]. Poor dietary habits are further linked to health-risk behaviors such as obesity, smoking, and alcohol use [
2,
3]. In Korea, the combined prevalence of overweight and obesity among adolescents increased from 18.8% in 2011 to 23.7% in 2019, while the proportion of adolescents skipping breakfast at least 5 days per week increased from 26.4% in 2013 to 39.0% in 2022 [
4,
5].
These changes reflect a marked shift in the dietary habits of Korean adolescents in recent years. Data from the Korea National Health and Nutrition Examination Survey (KNHANES) show that daily total energy intake declined from approximately 2,065 kcal in 2010 to 1,843 kcal in 2020, whereas the proportion of energy derived from fat increased from 24.0% to 26.2% [
6]. Excessive fat intake, particularly saturated fatty acids, has been linked to the increasing prevalence of obesity, raising concerns about nutritional imbalances and associated health risks [
6]. Because dietary habits established during adolescence can shape future eating behaviors and overall health, assessing these patterns and identifying potential risk factors during this critical period provides an important foundation for preventing chronic diseases and promoting long-term health.
According to the Global Burden of Disease Study, which analyzed data from 195 countries, unhealthy diets are a leading global health risk, contributing to more deaths than any other risk factor [
7]. The World Health Organization has likewise emphasized that poor dietary habits and physical inactivity are among the most critical drivers of global morbidity and mortality [
8,
9]. In this context, dietary pattern analysis has become a valuable tool for evaluating the combined effects and interactions of dietary components, offering a more realistic and predictive approach than single-nutrient analyses [
10,
11]. This is especially important during adolescence, when dietary patterns are shaped by complex biological, environmental, and sociocultural factors.
In line with this trend, recent studies have moved beyond nutrient-based analyses to consider broader contextual factors such as physical health indicators and living environments [
2,
12]. However, most existing research relies on short-term data, limiting the ability to assess long-term changes in adolescent dietary patterns. Moreover, potential sex-related differences have received relatively minimal attention [
13,
14].
To address these gaps, the present study utilized nationally representative, long-term data from the KNHANES and examined sex-specific differences in dietary behaviors. We aimed to identify major dietary patterns among Korean adolescents through cluster analysis of 16 years of survey data, assess secular trends in these patterns, and investigate how they differ by sex during adolescence.
MATERIALS AND METHODS
Study design and participants
This study analyzed data from the KNHANES, a nationally representative, cross-sectional survey conducted annually by the Korea Disease Control and Prevention Agency [
15]. The survey targets the non-institutionalized civilian population of Korea, and informed consent is obtained from all participants. Although KNHANES was initially conducted in 1998, 2001, and 2005, it has been administered annually since 2007. For this analysis, we used data collected between 2007 and 2022 to assess continuous, long-term secular trends in dietary patterns among Korean adolescents.
The initial sample included 7,810 adolescents aged 12–18 years who completed all 3 components of the KNHANES: the health interview/health behavior survey, health examination, and nutrition survey. Participants with implausible total daily energy intake (≤ 500 kcal or > 5,000 kcal; n = 131) were excluded. The final analytic sample consisted of 7,679 adolescents (boys: n = 4,065; girls: n = 3,614).
Dietary assessment
Dietary intake data were collected using a standardized 24-hour dietary recall. Trained interviewers recorded the time, type, and amount of all foods and beverages consumed by participants during the 24 hours preceding the reference day. To improve recall accuracy, visual aids such as food models and photographs were provided. From 2007 to 2021, the reference day was the day before the survey, and data were collected at participants’ homes. Beginning in 2022, the reference day was changed to 2 days before the survey, and interviews were conducted in mobile examination vehicles [
15].
To identify dietary patterns, food items were grouped into 26 categories using KNHANES food codes. Classification was primarily based on nutrient composition, with additional consideration of culinary use and the degree of food processing. Because grains and grain products contribute substantially to daily energy intake among adolescents, staple foods were further divided into 6 subgroups: whole grains, refined white rice, refined grains, wheat flour and bread, processed white rice, and flour-based foods. Salted vegetables, including kimchi, were classified separately within the vegetable category, given their higher contribution to sodium intake compared with fresh vegetables. Meat was subdivided into red meat, poultry, and processed meat, whereas beverages were categorized as fruit juices, tea and coffee, or sugar-sweetened beverages. Alcoholic beverages were excluded. In total, 26 food groups were defined: whole grains, refined white rice, refined grains, wheat flour and bread, processed white rice, flour-based foods, potatoes, sweets, legumes and tofu (including soymilk), nuts, non-salted vegetables, kimchi and salted vegetables, seasonings, fruits, red meat, poultry, processed meat, eggs, fish and seafood, seaweed, milk and dairy products, plant oils, animal oils, fruit juices, tea and coffee, and sugar-sweetened beverages. The detailed food items included in each group are provided in
Supplementary Table 1.
To assess each food group’s contribution to total energy intake while minimizing the influence of energy-dense groups and accounting for weight differences between solid and liquid items, we calculated the percentage of energy derived from each group. Dietary patterns were then identified using K-means clustering based on these percentages across the 26 food groups. The optimal number of clusters was determined using Ward’s method, and each pattern was assigned a descriptive name reflecting the dominant food groups consumed within the cluster.
Nutrient intake
Total daily energy intake was calculated from all reported foods and beverages. The percentage of energy from carbohydrates and protein was calculated as follows: (Carbohydrate or Protein (g) × 4 kcal)/Total Energy Intake (kcal) × 100. For fat, the following formula was used: (Fat (g) × 9 kcal)/Total Energy Intake (kcal) × 100. Nutrient intake was assessed for 14 components: total energy (kcal), protein (g), fat (g), carbohydrate (g), calcium (mg), phosphorus (mg), iron (mg), potassium (mg), vitamin A (retinol activity equivalents [RAE]), carotene (μg), thiamin (mg), riboflavin (mg), niacin (mg), and vitamin C (mg). For vitamin A, intake was calculated using retinol equivalents (Retinol + 1/6 × β-Carotene) until 2015. Following the revision of the Korean Dietary Reference Intakes (KDRI), the unit was changed to RAE (Retinol + 1/12 × β-Carotene) beginning in 2016. Accordingly, intake data from 2007 to 2015 were recalculated and are reported here using the RAE standard.
Demographic and lifestyle information
Data on age, residential area, household income, and vigorous physical activity were collected through face-to-face interviews conducted by trained interviewers. Residential areas were classified as urban or rural. Household income was assessed using equivalized monthly income, calculated by dividing total monthly household income by the number of household members, and was categorized into quartiles: low, lower-middle, upper-middle, and high. Vigorous physical activity was defined as engaging in high-intensity activity for at least 10 minutes per week and was categorized as “Yes” or “No.”
Smoking experience, alcohol consumption, and subjective body image perception were assessed using self-reported health questionnaires. Smoking experience was defined as having ever smoked, even a few puffs, and alcohol consumption as having ever consumed alcohol at any point in life; both were classified as “Yes” or “No.” Subjective body image perception was categorized into 3 groups: individuals who perceived themselves as very or slightly thin were classified as underweight, those who considered their body average were classified as just right, and those who viewed themselves as slightly or very overweight were classified as overweight.
Body mass index (BMI) was calculated using anthropometric measurements obtained by trained personnel. Weight status was classified into 3 categories according to age- and sex-specific BMI percentiles from the 2017 Korean National Growth Charts: underweight (BMI < 5th percentile), normal weight (5th ≤ BMI < 95th percentile), and obese (BMI ≥ 95th percentile).
The dietary behavior survey collected information on the frequency of skipping breakfast and dinner as well as whether participants shared meals with family members. Eating-out frequency was categorized into 3 groups: less than once per week, 1–6 times per week, and at least once daily. The definition of dietary supplement use varied by survey year: from 2007 to 2009, it referred to individuals who had ever used vitamins, minerals, or other functional health supplements, whereas from 2010 onward, it was defined as having consumed dietary supplements for at least 2 consecutive weeks within the past year.
Statistical analyses
The KNHANES uses a complex, stratified, multistage, clustered probability sampling design. To generate unbiased population estimates and ensure accurate variance estimation, all statistical analyses incorporated sampling weights, stratification variables, and clustering information. Analyses were conducted separately by sex, given its importance in explaining differences in adolescents’ dietary and behavioral patterns.
Dietary patterns were derived using hierarchical cluster analysis with Ward’s method, followed by non-hierarchical K-means clustering. Continuous variables are presented as weighted means with standard errors (SEs), whereas categorical variables are expressed as weighted proportions (%) with SEs. Group differences in categorical variables were assessed using the Rao–Scott χ2 test, whereas weighted linear regression models were applied to continuous variables.
Associations between dietary patterns and nutrient intake were examined using survey-weighted linear regression models, and least squares means with 95% confidence intervals were estimated. For each of the 3 dietary patterns, models were adjusted for age (years, continuous), energy intake (kcal/day, continuous), household income (low, lower-middle, upper-middle, high), BMI percentile category (underweight, normal weight, obese), and alcohol use experience (yes/no). These covariates were selected because they showed significant differences across dietary pattern groups in both sexes and had the potential to confound the associations between dietary patterns and nutrient intake.
To assess secular changes in the distribution of dietary patterns by sex, stratified Rao–Scott χ2 tests were conducted using weighted estimates. All analyses were performed with SAS software, version 9.4 (SAS Institute Inc., Cary, NC, USA), and statistical significance was set at 2-sided p < 0.05.
Ethics approval and consent to participate
All participants provided written informed consent. The protocols of KNHANES were reviewed and approved by the Institutional Review Board (IRB) of the Korea Disease Control and Prevention Agency. As this study used de-identified, publicly available KNHANES data, it qualified for exemption from additional IRB approval.
RESULTS
Characteristics of dietary patterns
Three major dietary clusters were identified through cluster analysis (
Table 1). Each cluster was characterized by predominant food group consumption patterns and labeled accordingly. The first cluster, representing 33.1% of the population (n = 2,545), was characterized by relatively high consumption of wheat flour and bread, red meat, poultry, and milk and dairy products. This cluster was labeled the Bread, Meat, & Dairy group. The second cluster, comprising 45.5% of the population (n = 3,496), was marked by a notably high intake of refined white rice and was designated the Rice-based Diet group. The third cluster, including 21.3% of participants (n = 1,638), was distinguished by high consumption of flour-based convenience foods such as noodles, ramyeon, udon, hotdogs, hamburgers, sandwiches, pizza, and dumplings. This cluster was labeled the Convenient Foods group.
Table 1Dietary pattern analysis using cluster analysis: mean percentage of energy intake from food groups among Korean adolescents
Table 1
|
Food groups (% energy) |
Bread, Meat, & Dairy (n = 2,545) |
Rice-based Diet (n = 3,496) |
Convenient Foods (n = 1,638) |
p value |
|
Whole grains |
3.6 ± 7.2 |
2.3 ± 4.1 |
2.1 ± 5.1 |
< 0.0001 |
|
Refined white rice |
18.8 ± 9.0 |
45.2 ± 10.7 |
18.9 ± 11.1 |
< 0.0001 |
|
Refined grains |
2.3 ± 4.6 |
1.9 ± 3.2 |
1.5 ± 3.2 |
< 0.0001 |
|
Wheat flour and bread |
14.5 ± 13.9 |
4.4 ± 6.4 |
4.9 ± 7.1 |
< 0.0001 |
|
Processed white rice |
0.5 ± 3.1 |
0.2 ± 1.7 |
0.3 ± 2.3 |
< 0.0001 |
|
Flour-based foods |
3.9 ± 5.9 |
3.4 ± 6.4 |
32.2 ± 12.7 |
< 0.0001 |
|
Potatoes |
1.6 ± 4.3 |
1.1 ± 3.2 |
1.5 ± 3.9 |
< 0.0001 |
|
Sweets |
4.7 ± 8.3 |
2.5 ± 4.6 |
2.5 ± 5.2 |
< 0.0001 |
|
Legumes and tofu/soymilk |
1.5 ± 3.0 |
1.8 ± 3.1 |
1.1 ± 2.8 |
< 0.0001 |
|
Nuts |
0.5 ± 1.8 |
0.4 ± 1.4 |
0.4 ± 1.7 |
0.0636 |
|
Non-salted vegetables |
2.6 ± 5.0 |
2.4 ± 2.9 |
1.8 ± 3.0 |
< 0.0001 |
|
Kimchi and salted vegetables |
0.9 ± 1.1 |
1.2 ± 1.3 |
0.9 ± 1.3 |
< 0.0001 |
|
Seasonings |
3.6 ± 4.1 |
2.8 ± 3.3 |
2.7 ± 3.1 |
< 0.0001 |
|
Fruits |
3.1 ± 5.5 |
2.8 ± 5.0 |
2.3 ± 4.9 |
< 0.0001 |
|
Red meat |
9.8 ± 12.0 |
7.6 ± 8.4 |
5.3 ± 7.7 |
< 0.0001 |
|
Poultry |
4.5 ± 9.4 |
2.1 ± 5.0 |
2.4 ± 5.9 |
< 0.0001 |
|
Processed meat |
1.3 ± 3.5 |
1.3 ± 3.6 |
1.0 ± 3.3 |
0.0077 |
|
Eggs |
2.2 ± 3.5 |
2.5 ± 3.8 |
2.3 ± 3.4 |
0.0011 |
|
Fish and seafood |
2.2 ± 4.1 |
2.9 ± 3.9 |
1.8 ± 3.1 |
< 0.0001 |
|
Seaweed |
0.2 ± 0.5 |
0.3 ± 0.8 |
0.2 ± 0.5 |
< 0.0001 |
|
Milk and dairy products |
9.4 ± 9.9 |
5.8 ± 7.2 |
6.6 ± 8.1 |
< 0.0001 |
|
Plant oils |
3.7 ± 4.1 |
3.0 ± 2.8 |
3.0 ± 3.3 |
< 0.0001 |
|
Animal oils |
0.3 ± 1.0 |
0.1 ± 0.4 |
0.1 ± 0.6 |
< 0.0001 |
|
Fruit juices |
0.6 ± 2.2 |
0.5 ± 1.9 |
0.5 ± 2.2 |
0.0747 |
|
Tea and coffee |
0.0 ± 0.2 |
0.0 ± 0.1 |
0.0 ± 0.1 |
0.4592 |
|
Sugar-sweetened beverages |
3.8 ± 6.1 |
1.6 ± 3.6 |
3.5 ± 5.9 |
< 0.0001 |
Sociodemographic characteristics by dietary patterns
Tables 2 and
3 present the sociodemographic characteristics of dietary pattern groups among adolescent boys and girls, respectively. Among boys, mean age differed significantly across dietary patterns (p = 0.0432); participants in the Convenient Foods group were the oldest (15.2 years), whereas those in the Rice-based Diet group were the youngest (15.0 years). Household income also varied: the Rice-based Diet group had the highest proportion of low-income participants (13.8%), whereas the Bread, Meat, & Dairy group included a relatively higher proportion of high-income individuals (34.0%). Regarding BMI percentile classification, the Rice-based Diet group showed the highest obesity prevalence (12.5%). Alcohol consumption experience was most common in the Convenient Foods group, wherein 41.7% reported having consumed alcohol. Skipping meals was also more frequent in this group, with 41.2% skipping breakfast and 6.6% skipping dinner. The frequency of eating out was high in both the Bread, Meat, & Dairy and Convenient Foods groups, with 44.4% of participants in each reporting eating out daily. Notably, the Bread, Meat, & Dairy group had the highest proportion of dietary supplement users (30.7%).
Table 2Sociodemographic and lifestyle characteristics of Korean adolescent boys by dietary patterns
Table 2
|
Characteristics |
All (n = 4,065) |
Bread, Meat, & Dairy (n = 1,218) |
Rice-based Diet (n = 1,943) |
Convenient Foods (n = 904) |
p value |
|
Age (yr) |
15.1 ± 0.0 |
15.1 ± 0.1 |
15.0 ± 0.1 |
15.2 ± 0.1 |
0.0432 |
|
Region of residence |
|
|
|
|
0.7597 |
|
City |
46.8 (1.1) |
45.7 (1.8) |
47.2 (1.5) |
47.5 (2.1) |
|
Rural |
53.2 (1.1) |
54.3 (1.8) |
52.9 (1.5) |
52.5 (2.1) |
|
Household income status |
|
|
|
|
0.0087 |
|
Low |
11.6 (0.7) |
8.8 (1.0) |
13.8 (1.0) |
10.7 (1.2) |
|
Lower-middle |
25.9 (0.9) |
24.5 (1.5) |
26.1 (1.3) |
27.3 (1.8) |
|
Upper-middle |
31.6 (1.0) |
32.7 (1.6) |
30.9 (1.3) |
31.8 (1.8) |
|
High |
30.8 (1.0) |
34.0 (1.7) |
29.2 (1.4) |
30.2 (1.8) |
|
Vigorous physical activity*
|
|
|
|
|
0.6250 |
|
No |
36.6 (1.1) |
37.0 (2.1) |
35.7 (1.4) |
38.2 (2.4) |
|
Yes |
63.4 (1.1) |
63.0 (2.1) |
64.3 (1.4) |
61.8 (2.4) |
|
Pediatric BMI percentile |
|
|
|
|
0.0327 |
|
Underweight (< 5th pct) |
10.8 (0.6) |
10.2 (1.1) |
11.4 (0.9) |
10.4 (1.2) |
|
Normal weight (5th–95th pct) |
78.6 (0.9) |
81.0 (1.4) |
76.2 (1.3) |
80.7 (1.6) |
|
Obesity (≥ 95th pct) |
10.6 (0.6) |
8.9 (0.9) |
12.5 (1.1) |
8.9 (1.1) |
|
Perceived weight status |
|
|
|
|
0.6243 |
|
Underweight |
33.1 (0.9) |
34.0 (1.6) |
32.6 (1.3) |
33.1 (1.8) |
|
Just right |
36.7 (0.9) |
37.9 (1.6) |
36.3 (1.3) |
36.0 (1.8) |
|
Overweight |
30.2 (0.8) |
28.2 (1.5) |
31.2 (1.2) |
30.8 (1.8) |
|
Smoking experience |
|
|
|
|
0.2973 |
|
Yes |
19.6 (0.8) |
19.1 (1.4) |
18.9 (1.1) |
21.8 (1.7) |
|
No |
80.4 (0.8) |
80.9 (1.4) |
81.1 (1.1) |
78.2 (1.7) |
|
Alcohol use experience |
|
|
|
|
0.0016 |
|
Yes |
36.0 (0.9) |
35.7 (1.6) |
33.5 (1.3) |
41.7 (1.9) |
|
No |
64.0 (0.9) |
64.3 (1.6) |
66.5 (1.3) |
58.3 (1.9) |
|
Skipping breakfast |
31.5 (0.9) |
32.1 (1.7) |
26.6 (1.2) |
41.2 (2.0) |
< 0.0001 |
|
Skipping dinner |
5.0 (0.4) |
5.4 (0.8) |
4.0 (0.5) |
6.6 (0.9) |
0.0319 |
|
Having breakfast with family |
69.7 (1.1) |
72.4 (2.0) |
69.4 (1.4) |
66.8 (2.4) |
0.1665 |
|
Having dinner with family |
68.6 (0.9) |
69.8 (1.7) |
68.5 (1.3) |
67.0 (2.0) |
0.5552 |
|
Frequency of eating out |
|
|
|
|
0.0025 |
|
< Once a week |
2.3 (0.4) |
1.1 (0.3) |
3.5 (0.7) |
1.4 (0.5) |
|
1–6 times/week |
54.4 (1.0) |
54.5 (1.7) |
54.4 (1.5) |
54.2 (1.9) |
|
Daily |
43.3 (1.0) |
44.4 (1.7) |
42.1 (1.4) |
44.4 (1.9) |
|
Taking dietary supplements |
26.7 (0.8) |
30.7 (1.6) |
24.8 (1.2) |
25.7 (1.7) |
0.0061 |
Table 3Sociodemographic and lifestyle characteristics of Korean adolescent girls by dietary patterns
Table 3
|
Characteristics |
All (n = 3,614) |
Bread, Meat, & Dairy (n = 1,327) |
Rice-based Diet (n = 1,553) |
Convenient Foods (n = 734) |
p value |
|
Age (yr) |
15.1 ± 0.0 |
15.2 ± 0.1 |
14.8 ± 0.1 |
15.3 ± 0.1 |
< 0.0001 |
|
Region of residence |
|
|
|
|
0.4158 |
|
City |
45.4 (1.2) |
47.0 (1.8) |
44.0 (1.6) |
45.5 (2.3) |
|
Rural |
54.6 (1.2) |
53.0 (1.8) |
56.0 (1.6) |
54.5 (2.3) |
|
Household income status |
|
|
|
|
0.0015 |
|
Low |
12.5 (0.8) |
9.1 (1.0) |
15.6 (1.2) |
12.8 (1.5) |
|
Lower-middle |
26.0 (1.0) |
25.7 (1.5) |
26.9 (1.5) |
25.0 (1.9) |
|
Upper-middle |
32.2 (1.0) |
34.7 (1.7) |
29.8 (1.4) |
32.4 (2.1) |
|
High |
29.3 (1.1) |
30.6 (1.7) |
27.7 (1.5) |
29.8 (2.2) |
|
Vigorous physical activity*
|
|
|
|
|
0.3371 |
|
No |
61.4 (1.2) |
63.5 (1.8) |
60.7 (1.7) |
59.3 (2.6) |
|
Yes |
38.6 (1.2) |
36.5 (1.8) |
39.3 (1.7) |
40.7 (2.6) |
|
Pediatric BMI percentile |
|
|
|
|
0.7947 |
|
Underweight (< 5th pct) |
7.8 (0.6) |
7.4 (0.8) |
8.1 (0.9) |
8.1 (1.2) |
|
Normal weight (5th–95th pct) |
82.6 (0.8) |
83.2 (1.2) |
82.8 (1.2) |
81.1 (1.8) |
|
Obesity (≥ 95th pct) |
9.6 (0.6) |
9.5 (1.0) |
9.1 (0.8) |
10.8 (1.4) |
|
Perceived weight status |
|
|
|
|
0.0323 |
|
Underweight |
17.2 (0.8) |
15.9 (1.1) |
19.3 (1.3) |
15.5 (1.6) |
|
Just right |
48.3 (1.0) |
48.5 (1.6) |
49.2 (1.5) |
46.2 (2.1) |
|
Overweight |
34.5 (1.0) |
35.6 (1.5) |
31.5 (1.4) |
38.3 (2.1) |
|
Smoking experience |
|
|
|
|
0.1745 |
|
Yes |
8.2 (0.6) |
8.4 (0.9) |
7.1 (0.8) |
9.8 (1.3) |
|
No |
91.8 (0.6) |
91.6 (0.9) |
92.9 (0.8) |
90.2 (1.3) |
|
Alcohol use experience |
|
|
|
|
0.0017 |
|
Yes |
30.0 (1.0) |
30.9 (1.5) |
26.5 (1.4) |
35.2 (2.2) |
|
No |
70.0 (1.0) |
69.1 (1.5) |
73.5 (1.4) |
64.8 (2.2) |
|
Skipping breakfast |
34.5 (1.0) |
39.0 (1.7) |
26.0 (1.5) |
42.7 (2.1) |
< 0.0001 |
|
Skipping dinner |
8.4 (0.5) |
11.6 (1.0) |
5.6 (0.7) |
8.5 (1.2) |
< 0.0001 |
|
Having breakfast with family |
67.1 (1.2) |
68.0 (2.0) |
68.3 (1.7) |
62.1 (2.8) |
0.1199 |
|
Having dinner with family |
67.5 (1.0) |
67.8 (1.7) |
68.6 (1.6) |
64.6 (2.1) |
0.3156 |
|
Frequency of eating out |
|
|
|
|
0.0102 |
|
< Once a week |
1.9 (0.3) |
1.3 (0.4) |
1.8 (0.5) |
2.8 (0.7) |
|
1–6 times/week |
56.8 (1.0) |
56.7 (1.6) |
59.7 (1.6) |
51.4 (2.2) |
|
Daily |
41.4 (1.0) |
42.0 (1.6) |
38.5 (1.6) |
45.8 (2.2) |
|
Taking dietary supplements |
25.7 (0.9) |
28.6 (1.4) |
23.4 (1.3) |
25.2 (1.9) |
0.0257 |
Among girls, as with boys, the mean age was highest in the Convenient Foods group (15.3 years) and lowest in the Rice-based Diet group (14.8 years). Household income patterns were similar: the Rice-based Diet group had the highest proportion of low-income participants (15.6%), whereas the Bread, Meat, & Dairy group had a relatively higher proportion of high-income individuals (30.6%). In terms of perceived weight status, the Convenient Foods group had the highest proportion of participants who perceived themselves as underweight (15.5%) as well as those who perceived themselves as obese (38.3%). Alcohol consumption experience was also most frequent in this group, with 35.2% reporting alcohol use. The Convenient Foods group exhibited the highest rate of breakfast skipping (42.7%), whereas dinner skipping was most prevalent in the Bread, Meat, & Dairy group (11.6%). Eating out was most common in the Convenient Foods group, with 45.8% reporting daily eating out. Consistent with the findings among boys, the Bread, Meat, & Dairy group had the highest proportion of dietary supplement users (28.6%).
Nutrient intake by dietary patterns
Tables 4 and
5 present nutrient intake levels by dietary patterns among boys and girls, respectively. After multivariable adjustment, estimated daily energy intake ranged from 2,170.3 to 2,527.6 kcal in boys and from 1,720.7 to 1,970.9 kcal in girls, indicating substantial variation across patterns. Among boys, intake of all nutrients except carotene differed significantly by dietary pattern. The Rice-based Diet group had the highest proportion of energy from carbohydrates (64.4%), whereas the Bread, Meat, & Dairy group had the highest proportions from fat (28.6%) and protein (15.6%). Among girls, intake of all nutrients except thiamine differed significantly by dietary pattern. Similar to boys, the Rice-based Diet group showed the highest carbohydrate contribution (65.4%), whereas the Bread, Meat, & Dairy group showed the highest fat (27.7%) and protein (14.7%) contributions.
Table 4Least-squares means and 95% confidence intervals of nutrient intake and energy distribution by dietary patterns among Korean adolescent boys
Table 4
|
Dietary component |
Bread, Meat, & Dairy (n = 1,218) |
Rice-based Diet (n = 1,943) |
Convenient Foods (n = 904) |
p value |
|
Energy (kcal) |
2,527.6 (2,467.6–2,587.5) |
2,170.3 (2,126.8–2,213.7) |
2,247.9 (2,185.2–2,310.7) |
< 0.0001 |
|
Protein (g) |
90.4 (88.4–92.3) |
84.5 (83.4–85.6) |
79.7 (78.1–81.4) |
< 0.0001 |
|
Fat (g) |
75.6 (74.0–77.2) |
53.6 (52.7–54.6) |
65.9 (64.4–67.5) |
< 0.0001 |
|
Carbohydrate (g) |
314.7 (310.1–319.3) |
368.1 (365.4–370.9) |
346.5 (342.1–350.8) |
< 0.0001 |
|
Calcium (mg) |
598.3 (574.5–622.1) |
511.8 (498.2–525.3) |
551.6 (529.7–573.5) |
< 0.0001 |
|
Phosphorus (mg) |
1,277.7 (1,256.1–1,299.3) |
1,287.8 (1,272.1–1,303.5) |
1,125.7 (1,103.5–1,147.9) |
< 0.0001 |
|
Iron (mg) |
13.8 (13.1–14.5) |
14.5 (13.3–15.7) |
12.9 (12.2–13.6) |
0.0170 |
|
Potassium (mg) |
2,812.0 (2,742.7–2,881.3) |
2,821.1 (2,775.0–2,867.2) |
2,579.2 (2,508.8–2,649.6) |
< 0.0001 |
|
Vitamin A (RAE) |
490.4 (451.0–529.8) |
417.7 (398.5–437.0) |
422.9 (349.2–496.6) |
0.0029 |
|
Carotene (μg) |
3,037.5 (2,630.1–3,444.9) |
3,102.7 (2,918.3–3,287.1) |
3,083.5 (2,221.0–3,945.9) |
0.9531 |
|
Thiamin (mg) |
1.7 (1.7–1.8) |
1.7 (1.7–1.7) |
1.6 (1.6–1.7) |
0.0186 |
|
Riboflavin (mg) |
1.7 (1.7–1.8) |
1.5 (1.5–1.5) |
1.8 (1.8–1.9) |
< 0.0001 |
|
Niacin (mg) |
17.3 (16.8–17.7) |
17.0 (16.7–17.3) |
14.4 (13.9–14.8) |
< 0.0001 |
|
Vitamin C (mg) |
79.6 (73.8–85.5) |
82.0 (77.1–87.0) |
68.6 (62.1–75.1) |
0.0042 |
|
% Energy*
|
|
|
|
|
|
Carbohydrate (%EN) |
55.3 (54.5–56.0) |
64.4 (64.0–64.9) |
60.3 (59.6–61.0) |
< 0.0001 |
|
Fat (%EN) |
28.6 (28.0–29.2) |
20.1 (19.7–20.4) |
25.4 (24.8–25.9) |
< 0.0001 |
|
Protein (%EN) |
15.6 (15.3–15.9) |
14.6 (14.4–14.8) |
13.6 (13.3–13.9) |
< 0.0001 |
Table 5Least-squares means and 95% confidence intervals of nutrient intake and energy distribution by dietary patterns among Korean adolescent girls
Table 5
|
Dietary component |
Bread, Meat, & Dairy (n = 1,327) |
Rice-based Diet (n = 1,553) |
Convenient Foods (n = 734) |
p value |
|
Energy (kcal) |
1,970.9 (1,924.2–2,017.6) |
1,720.7 (1,683.4–1,758.0) |
1,802.9 (1,748.9–1,857.0) |
< 0.0001 |
|
Protein (g) |
67.4 (65.8–69.0) |
65.1 (64.1–66.0) |
63.5 (61.9–65.0) |
0.0027 |
|
Fat (g) |
57.9 (56.6–59.1) |
41.8 (40.9–42.6) |
50.4 (49.0–51.8) |
< 0.0001 |
|
Carbohydrate (g) |
258.6 (255.0–262.2) |
296.8 (294.4–299.3) |
280.4 (276.6–284.2) |
< 0.0001 |
|
Calcium (mg) |
482.5 (466.2–498.8) |
409.6 (397.2–422.0) |
432.9 (415.4–450.4) |
< 0.0001 |
|
Phosphorus (mg) |
986.0 (969.6–1002.4) |
1003.0 (990.1–1016.0) |
892.4 (871.8–913.1) |
< 0.0001 |
|
Iron (mg) |
10.4 (10.0–10.9) |
11.0 (10.7–11.4) |
9.8 (9.3–10.3) |
< 0.0001 |
|
Potassium (mg) |
2,230.7 (2,183.0–2,278.5) |
2,292.3 (2,250.7–2,333.9) |
2,102.6 (2,031.1–2,174.0) |
< 0.0001 |
|
Vitamin A (RAE) |
378.5 (354.4–402.6) |
336.6 (321.1–352.1) |
299.3 (279.3–319.3) |
< 0.0001 |
|
Carotene (μg) |
2,275.6 (2,031.3–2,519.9) |
2,558.9 (2,384.9–2,733.0) |
1,987.3 (1,813.7–2,161.0) |
< 0.0001 |
|
Thiamin (mg) |
1.3 (1.3–1.3) |
1.3 (1.3–1.3) |
1.3 (1.2–1.3) |
0.2686 |
|
Riboflavin (mg) |
1.4 (1.3–1.4) |
1.2 (1.1–1.2) |
1.4 (1.3–1.4) |
< 0.0001 |
|
Niacin (mg) |
13.0 (12.6–13.3) |
13.2 (12.9–13.5) |
11.7 (11.3–12.1) |
< 0.0001 |
|
Vitamin C (mg) |
72.6 (67.3–77.9) |
76.3 (71.5–81.0) |
62.4 (55.6–69.1) |
0.0035 |
|
% Energy*
|
|
|
|
|
|
Carbohydrate (%EN) |
57.3 (56.5–58.0) |
65.4 (64.9–65.9) |
61.4 (60.6–62.2) |
< 0.0001 |
|
Fat (%EN) |
27.7 (27.1–28.2) |
19.7 (19.3–20.1) |
24.6 (24.0–25.2) |
< 0.0001 |
|
Protein (%EN) |
14.7 (14.4–15.0) |
14.3 (14.1–14.5) |
13.6 (13.3–14.0) |
< 0.0001 |
Secular trends in dietary patterns by sex
Secular trends in the distribution of the 3 dietary patterns (Bread, Meat, & Dairy, Rice-based Diet, and Convenient Foods) from 2007 to 2022 were analyzed by sex (
Figure 1). Overall, adherence to the Bread, Meat, & Dairy pattern increased markedly from 23.7% in 2007 to 48.4% in 2022, with a sustained upward trend particularly after 2010. Conversely, adherence to the Rice-based Diet pattern declined from 54.4% to 30.7%, reflecting a gradual shift away from traditional dietary habits. The Convenient Foods pattern remained relatively stable but showed a temporary increase to about 30% between 2016 and 2020, followed by a decline thereafter.
Figure 1Secular trends in dietary patterns by sex among Korean adolescents: (A) total sample, (B) boys, (C) girls.
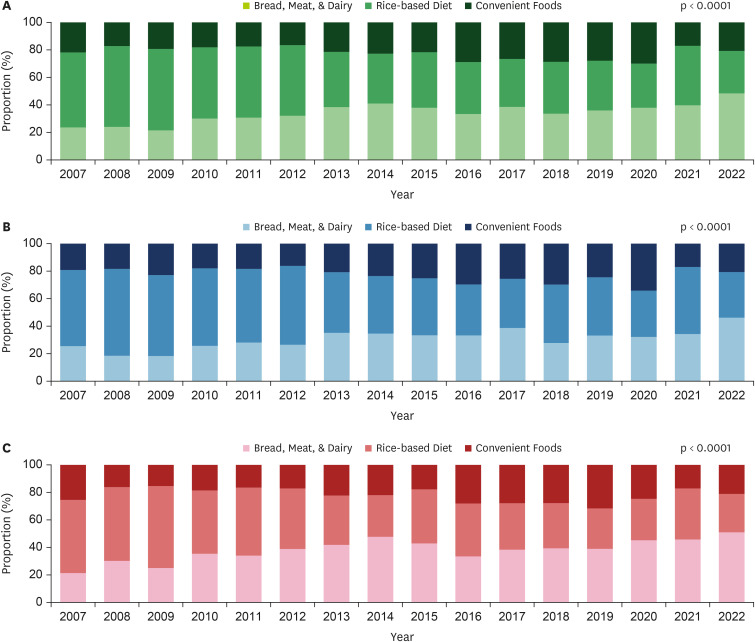
Among boys, adherence to the Bread, Meat, & Dairy pattern increased from 25.5% in 2007 to 46.2% in 2022, whereas adherence to the Rice-based Diet pattern decreased from 55.4% to 33.2%, with a transient rebound to 48.7% observed in 2021. The Convenient Foods pattern showed irregular fluctuations over time. Among girls, changes in dietary patterns were more pronounced. The Bread, Meat, & Dairy pattern more than doubled, increasing from 21.3% in 2007 to 51.0% in 2022, with a consistent upward trend after 2013. Conversely, adherence to the Rice-based Diet pattern declined markedly from 53.2% to 27.9%, reflecting a substantial reduction in traditional eating habits. The Convenient Foods pattern showed a gradual downward trend, peaking at 31.6% in 2019 before declining to 21.1% in 2022. These shifts differed significantly by sex, and temporal changes were statistically significant (p < 0.0001).
DISCUSSION
This study identified 3 major dietary patterns among Korean adolescents: Bread, Meat, & Dairy, Rice-based Diet, and Convenient Foods. Between 2007 and 2022, the proportion of adolescents in the Bread, Meat, & Dairy group increased, whereas those in the Rice-based Diet group decreased from 54.4% to 30.7%, indicating a clear secular trend toward Westernized eating patterns and a gradual shift from traditional diets. These changes were evident in both sexes but were more pronounced among girls. Obesity prevalence and body image perception also varied by dietary pattern and sex. Among boys, obesity prevalence was highest in the Rice-based Diet group, whereas among girls, the Convenient Foods group had the highest proportion who perceived themselves as obese.
Energy contributions from macronutrients across the 3 dietary patterns revealed distinct sex-related differences. The Rice-based Diet group had the highest proportion of energy from carbohydrates (boys: 64.4%, girls: 65.4%), whereas the Bread, Meat, & Dairy group showed the highest contributions from fat (boys: 28.6%, girls: 27.7%) and protein (boys: 15.6%, girls: 14.7%). These macronutrient distributions reflect the predominant foods within each pattern, indicating that dietary pattern classification captures not only the types of foods consumed but also the qualitative aspects of nutrient intake. Notably, the carbohydrate energy ratio in the Rice-based Diet pattern was generally high and, in some cases, approached or slightly exceeded the upper limit of 65% recommended by the KDRI [
16]. Over time, adherence to this pattern has declined, consistent with previous analyses of 2010–2020 KNHANES data showing reduced carbohydrate intake among adolescents [
6]. These findings suggest that Korean adolescents are gradually shifting away from traditional rice-based diets toward more diverse dietary patterns. The declining trend in rice consumption—an important indicator of rice-centered diets—has also been consistently documented in prior research, including analyses of the 1998, 2001, and 2005 KNHANES datasets [
17] and studies based on data from 2007 to 2018 [
2].
In this study, estimated energy intake ranged from 2,170.3 to 2,527.6 kcal among boys and from 1,720.7 to 1,970.9 kcal among girls. Compared with the KDRI—2,700 kcal for boys and 2,000 kcal for girls aged 15–18 years and 2,500 kcal for boys and 2,000 kcal for girls aged 12–14 years—boys in some dietary pattern groups met the recommended levels, whereas girls fell short in all groups [
16]. The relatively low energy intake among girls may not be explained solely by reduced food quantity but may also reflect sociocultural pressures surrounding body image and appearance during adolescence. In this study, the prevalence of breakfast and dinner skipping was higher in girls (34.5% and 8.4%, respectively) than in boys (31.5% and 5.0%, respectively). Similarly, a greater proportion of girls (34.5%) than boys (30.2%) perceived themselves as overweight. These findings suggest that girls are more likely to engage in weight-control behaviors such as meal restriction or skipping, possibly due to increased body image concerns. A previous study reported comparable patterns, showing that adolescents—particularly girls—who overestimate their weight more frequently adopt unhealthy weight-control practices, including fasting and meal skipping, which are closely associated with reduced energy intake [
18]. Distorted weight perception has also been linked to lower energy and carbohydrate intake, poorer dietary quality, and adverse mental health outcomes [
19,
20]. Evidence from other countries supports these findings. A systematic review reported similar trends in Spain, Taiwan, and Japan. For example, a Spanish study found that overweight girls who desired weight loss were more likely to skip breakfast, whereas research in Japan indicated that girls who overestimated their weight were more likely to consume snacks after dinner [
21]. Taken together, these findings highlight that body dissatisfaction and weight misperception are highly prevalent during adolescence and are strongly associated with restrictive or unhealthy eating behaviors. The present results, combined with international evidence, suggest that adolescent dietary behaviors are shaped not only by physiological needs but also by psychological and sociocultural influences, particularly body image concerns and appearance-related pressures.
The proportion of adolescents adhering to the Convenient Foods dietary pattern remained relatively stable overall but temporarily increased between 2016 and 2020, followed by a decline. This trend was observed in both boys and girls. Within this pattern, flour-based foods accounted for 32.2% of intake (the highest among the 3 dietary patterns) and included fast and convenience foods such as instant noodles, hamburgers, pizza, and dumplings. Consumption of these foods decreased after 2020, likely due to the coronavirus disease 2019 (COVID-19) pandemic. Social distancing measures, school closures, and reduced opportunities for eating out may have temporarily lowered convenience food intake. Supporting this interpretation, a prior study reported that ultra-processed food consumption among Korean adolescents declined during the pandemic, with particularly substantial reductions in fast food intake [
22]. Similarly, a global systematic review of adolescent dietary changes identified comparable patterns, attributing them to the structural and situational effects of the pandemic [
23]. However, following the effective end of the pandemic in 2023, the prevalence of this dietary pattern may increase again. Indeed, a recent study using KNHANES data showed that the proportion of energy intake from ultra-processed foods has steadily increased from 1998 to 2022, with the only interruption occurring during the COVID-19 period, suggesting a persistent long-term upward trend [
24].
From 2007 to 2022, the dietary patterns of Korean adolescents shifted markedly from traditional rice-based meals toward a more Westernized pattern centered on bread, meat, and dairy products. Among girls, adherence to the Bread, Meat, & Dairy pattern increased from 21.3% to 51.0%, whereas adherence to the Rice-based Diet declined from 53.2% to 27.9%. A similar trend was observed among boys. These findings indicate a continuing Westernization of adolescent dietary habits in Korea since the 2000s, consistent with a previous report documenting decreased rice consumption alongside increased intake of Western food groups such as meat and dairy products [
25]. Western dietary patterns are generally associated with increased risk of metabolic syndrome, including obesity, hypertriglyceridemia, and low high-density lipoprotein (HDL)-cholesterol levels [
26]. However, evidence also suggests that a traditional rice-and-kimchi–based diet, when combined with a high-carbohydrate/low-fat composition and low levels of physical activity, may contribute to metabolic abnormalities such as elevated triglyceride and reduced HDL-cholesterol levels. Conversely, the Bread, Meat, Fruit and Milk pattern has been associated with higher HDL-cholesterol levels and a lower prevalence of low HDL-cholesterol levels, suggesting more favorable effects on certain metabolic indicators [
24]. These findings underscore the need to move beyond a simple dichotomy between traditional and Western diets. Instead, emphasis should be placed on the qualitative composition of each dietary pattern and related lifestyle behaviors. A traditional high-carbohydrate/low-fat diet may increase metabolic risk when paired with low physical activity, whereas a Westernized diet with a balanced intake of protein and fat may offer benefits for specific metabolic outcomes. Future research should further investigate how traditional and Western dietary patterns during adolescence differentially influence the risk of metabolic diseases.
This study identified notable sex differences in dietary patterns among Korean adolescents, highlighting the importance of incorporating sex-specific characteristics in future analyses and interventions. Although previous research has consistently emphasized differences in dietary perceptions and behaviors between males and females, few studies have systematically examined these differences at the level of dietary patterns [
27]. Preferences for and adherence to certain patterns may vary by sex not only due to biological factors but also because of sociocultural expectations, body image perceptions, and health-related behaviors. Therefore, future research should consider sex not merely as a confounding variable but as a key analytical dimension for exploring the relationship between dietary patterns and health outcomes. Such an approach will deepen understanding of adolescent eating behaviors and support the development of sex-specific nutrition education and policy strategies.
This study has several limitations. First, because it was based on cross-sectional KNHANES data, causal relationships cannot be inferred. Second, dietary intake was assessed using a single-day, self-reported 24-hour recall, which may have introduced recall and social desirability bias (particularly among adolescents), potentially affecting the accuracy of dietary information. Third, although long-term dietary patterns and sociodemographic characteristics were examined, associations with health outcomes such as cardiometabolic risk factors were not assessed, limiting the ability to determine how adolescent dietary patterns may influence future health risks.
Despite these limitations, this study has several strengths. First, by using data from the KNHANES, a large-scale, nationally representative survey, the findings can be generalized to the broader population of Korean adolescents. Second, to our knowledge, this is the first study to conduct an exploratory analysis of dietary patterns among adolescents aged 12–18 years using the most recent 16 years of data, providing valuable insights into both dietary patterns and their composition. Finally, by examining sociodemographic and lifestyle characteristics alongside nutrient intake across dietary patterns, this study offers a comprehensive understanding of adolescent dietary behaviors. These findings provide important evidence to inform tailored, equitable nutrition intervention strategies that account for both sex and socioeconomic status.
CONCLUSION
This study identified 3 major dietary patterns among Korean adolescents—Bread, Meat, & Dairy, Rice-based Diet, and Convenient Foods—using KNHANES data from 2007 to 2022. A clear secular trend was observed, reflecting a shift from traditional rice-based diets toward more Westernized patterns, particularly among girls. Across all dietary patterns, girls reported lower energy intake than that recommended by the KDRI, likely influenced in part by psychosocial factors such as body image concerns and weight perception. The Convenient Foods group showed the highest prevalence of unhealthy behaviors, including frequent breakfast skipping and alcohol consumption, suggesting associations between this pattern and health-risk behaviors. Overall, these findings indicate that adolescent dietary patterns are shaped not only by food choices but also by broader sociocultural and psychological influences, including sex and body image perceptions. Future nutrition policies and interventions should adopt tailored approaches that account for sex-specific and socioeconomic differences in dietary behaviors. Such efforts are essential to foster healthier eating habits and support the long-term health of adolescents.
Duksung Women’s Universityhttps://doi.org/10.13039/501100002475
3000010124
NOTES
-
Funding: This research was supported by Duksung Women’s University Research Grant (No. 3000010124).
-
Conflict of Interest: The authors declare that they have no competing interests.
-
Author Contributions:
Conceptualization:Tak E, Kang M.
Data curation:Tak E.
Formal analysis:Tak E.
Methodology:Tak E, Kang M.
Supervision:Kang M.
Writing - original draft:Tak E, Kang E.
Writing - review & editing:Tak E, Kang E, Kang M.
SUPPLEMENTARY MATERIAL
Supplementary Table 1
Food items by food group used in the cluster analysis
cnr-14-270-s001.xls
REFERENCES
- 1. Nam HK. Examining the impact of nutrition education on health behaviors among Korean adolescents. Culin Sci Hosp Res 2025;31:55-72.
- 2. Park JY, Baik I. Secular trends and association of adolescent dietary patterns with alcohol and tobacco use and dietary behaviors: using 12-year data from the Korea National Health and Nutrition Examination Survey. J Korean Soc Food Sci Nutr 2022;51:213-220.
- 3. Choi MK, Lee YS. The dietary behaviors, taste preferences, and nutrient intakes of obese children consuming unbalanced diets. J East Asian Soc Diet Life 2008;18:127-134.
- 4. Kim HY, Kim JH. Temporal trends in the prevalence of metabolically healthy overweight and obesity in Korean youth: data from the Korea National Health and Nutrition Examination Survey 2011-2019. Ann Pediatr Endocrinol Metab 2022;27:134-141.
- 5. Shim JS, Lee JM, Kim Y, Choi S, Oh K. Trends in dietary behavior of Korean adolescents: Korea Youth Risk Behavior Survey 2013–2022. Public Health Wkly Rep 2024;17:1563-1590.
- 6. Sung DI, Kwon YJ, Heo SJ, Lee JW. Secular trends in dietary energy, carbohydrate, protein and fat intake among Korean children and adolescents. Public Health Nutr 2024;27:e251.
- 7. GBD 2017 Diet Collaborators. Health effects of dietary risks in 195 countries, 1990-2017: a systematic analysis for the Global Burden of Disease Study 2017. Lancet 2019;393:1958-1972.
- 8. GBD 2017 Disease and Injury Incidence and Prevalence Collaborators. Global, regional, and national incidence, prevalence, and years lived with disability for 354 diseases and injuries for 195 countries and territories, 1990-2017: a systematic analysis for the Global Burden of Disease Study 2017. Lancet 2018;392:1789-1858.
- 9. World Health Organization. Healthy diet. 2020. cited 2025 July 15. Available from https://www.who.int/news-room/fact-sheets/detail/healthy-diet
- 10. Hu FB. Dietary pattern analysis: a new direction in nutritional epidemiology. Curr Opin Lipidol 2002;13:3-9.
- 11. McMullen S. Childhood obesity: the impact on long-term risk of metabolic and CVD is not necessarily inevitable. Proc Nutr Soc 2014;73:389-396.
- 12. Lee S, Choi S, Ahn SE, Park YJ, Hwang JY, et al. Food-related media use and eating behavior in different food-related lifestyle groups of Korean adolescents in metropolitan areas. Nutr Res Pract 2024;18:687-700.
- 13. Kim JY, Song K, Choi Y, Choi BS, Chae HW. Analysis of risk factors affecting obesity in Korean adolescents: based on the 2017-2020 Korea national health and nutrition examination survey. Front Nutr 2025;12:1554218.
- 14. Yun YJ, Kwon YJ, Lee Y, Heo SJ, Lee JW. Association of dietary habits with general and abdominal obesity in Korean children and adolescents: cluster analysis of nationwide population survey data. Front Endocrinol (Lausanne) 2024;15:1424761.
- 15. Kweon S, Kim Y, Jang MJ, Kim Y, Kim K, et al. Data resource profile: the Korea National Health and Nutrition Examination Survey (KNHANES). Int J Epidemiol 2014;43:69-77.
- 16. The Korean Nutrition Society. Dietary Reference Intakes for Koreans. 2020. cited 2025 July 15. Available from https://www.kns.or.kr/FileRoom/FileRoom_view.asp?idx=108&BoardID=Kdr
- 17. Song Y, Park MJ, Paik HY, Joung H. Secular trends in dietary patterns and obesity-related risk factors in Korean adolescents aged 10-19 years. Int J Obes 2010;34:48-56.
- 18. Lim H, Lee HJ, Park S, Kim CI, Joh HK, et al. Weight misperception and its association with dieting methods and eating behaviors in South Korean adolescents. Nutr Res Pract 2014;8:213-219.
- 19. Shin S, Shin WK, Kim Y. A study on effects of subjective perception to nutrient intake and mental health of Korean adolescents: using the Korea National Health and Nutrition Examination Survey. J Korean Home Econ Educ Assoc 2017;29:93-109.
- 20. Lee J, Lee Y. The association of body image distortion with weight control behaviors, diet behaviors, physical activity, sadness, and suicidal ideation among Korean high school students: a cross-sectional study. BMC Public Health 2015;16:39.
- 21. Bodega P, de Cos-Gandoy A, Fernández-Alvira JM, Fernández-Jiménez R, Moreno LA, et al. Body image and dietary habits in adolescents: a systematic review. Nutr Rev 2023;82:104-127.
- 22. Hwang HJ, Kim YK. Changes in ultra-processed food consumption among adolescents before and after the COVID-19 pandemic: using data from the 7th (2018–2019) and 8th (2020–2021) Korea National Health and Nutrition Examination Survey. Korean J Hum Ecol 2024;33:981-994.
- 23. Pourghazi F, Eslami M, Ehsani A, Ejtahed HS, Qorbani M. Eating habits of children and adolescents during the COVID-19 era: a systematic review. Front Nutr 2022;9:1004953.
- 24. Lee H, Yim Y, Cho Y, Oh J, Kim S, et al. Long-term trends and patterns in ultra-processed food consumption among Korean adults from 1998 to 2022. Sci Rep 2025;15:4131.
- 25. Joung H, Hong S, Song Y, Ahn BC, Park MJ. Dietary patterns and metabolic syndrome risk factors among adolescents. Korean J Pediatr 2012;55:128-135.
- 26. Cunha CM, Costa PRF, de Oliveira LPM, Queiroz VAO, Pitangueira JCD, et al. Dietary patterns and cardiometabolic risk factors among adolescents: systematic review and meta-analysis. Br J Nutr 2018;119:859-879.
- 27. Woo T, Lee HJ, Lee KA, Lee SM, Lee KH. Gender differences in adolescents’ dietary perceptions and practices. Korean J Community Nutr 2016;21:165-177.